 |
| Figure 4.1 Ruminant requirements for major metabolites according to productive state |
This chapter defines the aspects of the metabolism of the end-products of digestion that limit the productivity of ruminants. Using this information it should be possible to combine efficiently the feed resources that are available to provide the nutrients needed for diverse functions such as work, growth, reproduction and milk production.
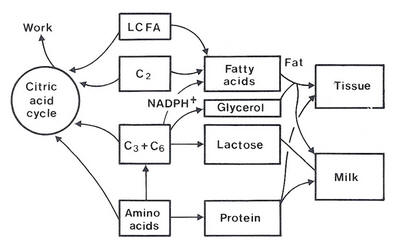
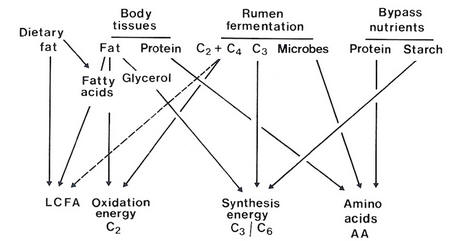
The metabolites needed for the above functions are oxidative energy (acetate and butyrate, referred to as C2 energy), glucogenic energy, arising largely from propionate or in some situations alimentary glucose (C3 + C6 energy), amino acids (largely microbial protein and dietary bypass protein) and dietary long-chain fatty acids (LCFAs). The gross inter-relationships of these metabolites for synthesis of tissues and milk and for work are shown in Figure 4.1.
|
| Figure 4.1 Ruminant requirements for major metabolites according to productive state |
To provide the background for the recommendations made in the guidelines for feeding ruminants given in Chapter 7, the pathways of metabolism of VFAs and protein are discussed, emphasising the interrelationships that exist between, for instance, fat synthesis, glucose metabolism and availability of dietary LCFAs.
.
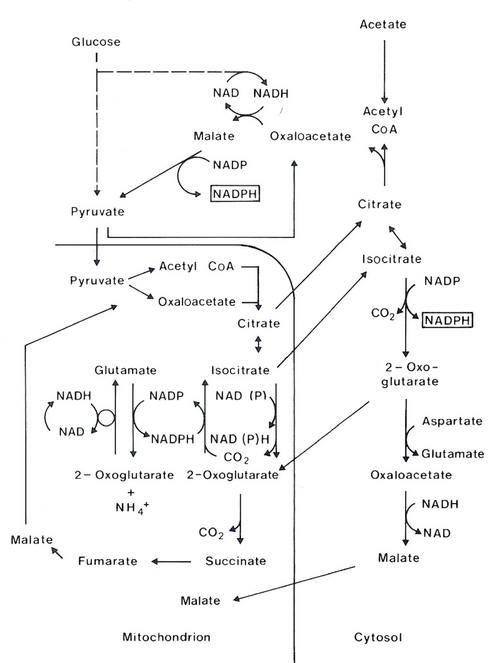
The pathways of metabolism of the VFAs are illustrated in Figure 4.2, indicating the sites at which high-energy phosphate bonds are generated. Theoretically, complete oxidation of acetyl CoA, propionyl CoA and butyryl CoA is coupled to the generation of 12, 20 and 29 moles of ATP per mole, respectively. Two moles of ATP are required per mole of VFA activated to its CoA derivative.
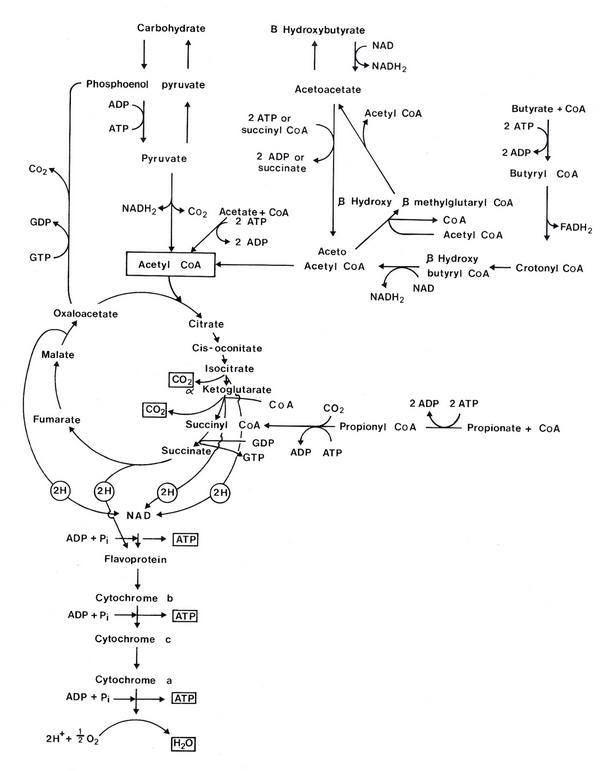 |
| Figure 4.2 Metabolism of VFA in ruminants in relation to the availability of ATP. |
The conversion of a large proportion of butyrate to ketone bodies and of propionate to glucose before oxidation reduces the efficiency with which the overall reactions are coupled to ATP generation. For instance, 4 moles of ATP are required to synthesise one mole of glucose from propionate. Thus gluconeogenesis from propionate prior to oxidation of the glucose markedly reduces the efficiency with which propionate oxidation is coupled to ATP generation. Similarly, if butyrate and acetate are converted to long-chain fatty acids or ketone bodies prior to oxidation, the efficiency with which these are used to generate ATP is also reduced.
The results of Orskov and Allen (1966) for the efficiency of utilisation of VFAs in growing lambs tend to be consistent with the net ATP availability, in contrast to early calorimetric studies, which indicated a marked inefficiency in the use of acetate. However, recent studies indicate that if the proportion of glucogenic energy in the total VFA energy is high, acetate is used with high efficiency (Tyrrell et al. 1979). Thus ruminants appear to use acetate inefficiently only when there is a deficiency of glucose precursors.
The pre-gastric fermentation of feeds in ruminants decomposes most of the soluble sugars and starches in the feed and the amount of glucose absorbed is a small proportion of that in the diet. In ruminants on grain-based diets the amount of starch that escapes rumen fermentation appears to depend on animal species and the particular grain and its form of preparation. Starches from maize, rice and sorghum grain are comparatively resistant to ruminal fermentation and a considerable proportion of starch from these grains passes to the lower intestines where it is digested and absorbed (Waldo 1973).
Estimates of the absorption of glucose in sheep on roughage diets indicate that only 5-10g of dietary glucose become available for absorption each day (see Leng 1970b). Considerable quantities of glucose are, however, utilised by ruminants. In a sheep at maintenance, which may be receiving only 5 to 10g of alimentary glucose, 80 to 120g of glucose are apparently synthesised daily (see Leng 1970b) depending on diet and physiological state.
Glucose appears to be an essential metabolite for a number of tissues, in particular the red blood cells and the brain. Glucose oxidation is also necessary for the formation of a proportion (about 70%) of the co-factors (reduced NADP) for synthesis of LCFAs. Ruminants synthesise glucose from propionate and amino acids. Provided that animals have unrestricted access to a good-quality feed they appear to be able to synthesise as much glucose as they need from propionate absorbed from the alimentary tract (Leng 1970b). This is discussed more fully in relation to the balance of nutrients.
The concept that the small amount of glucose and glucose precursors available from the digestive tracts of ruminants on basal diets low in grain (starch) may limit animal productivity in many situations is discussed below.
In animals on grain-based diets some starch escapes fermentation and is digested to and absorbed as glucose from the intestines (see Waldo 1973). With diets of crop residues, byproducts and dry pastures, little glucose is absorbed and gluconeogenesis provides the glucose needed to support essential functions.
The precursors of glucose have been extensively researched. The absorbed products that give rise to glucose are propionate and amino acids. Experiments using isotope dilution techniques have indicated that 50 to 60% of the glucose is synthesised from propionate (Leng et al. 1967; Bergman et al. 1966). Recent studies, however, suggest that these data are subject to considerable error. There are two problems: (i) indiscriminate exchange of isotope from propionate, and (ii) equilibration of isotope in the intermediates of metabolism of propionate. These sources of error result in estimates of the gluconeogenesis from propionate being highly underestimated.
Glucose turnover rate in relation to the digestible energy intake (Source: Herbein et al. 1978)
Discussion of the errors introduced by using isotope techniques is outside the scope of this book. However, it is likely that much more glucose arises from propionate than previously reported, particularly in animals on diets which result in high acetate fermentation in the rumen. Propionate may contribute 80-90% of the glucose synthesised in sheep on roughage diets (Cridland 1984).
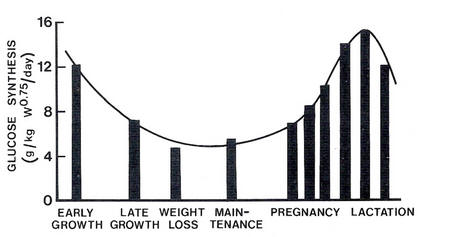
The pattern of apparent requirements for glucose is very similar to that for amino acids, suggesting that a small part of the requirements for amino acids may be a requirement for glucogenic compounds (Figure 4.3 and Figure 4.4).
 |
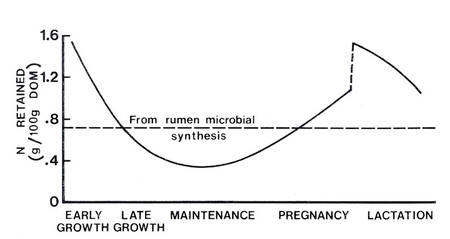 |
| Figure 4.3 Rate of glucose synthesis according to productive state in sheep (Source: Leng et al. 1977). |
Figure 4.4 Nitrogen retention in sheep in different physiological states. The data indicate the trends in the relative requirements for amino acids (Source: Orskov 1970) |
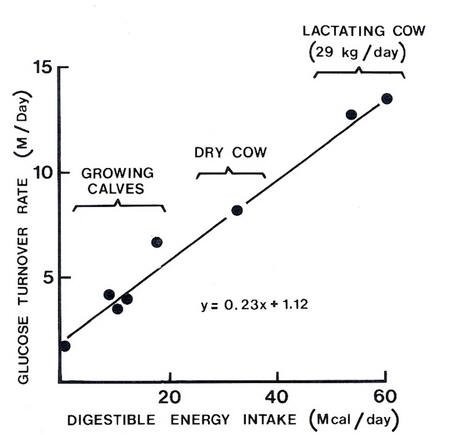
In both growing and lactating animals there may be some competition between needs for amino acids for glucose synthesis and for protein deposition, particularly at high levels of productivity. Growing, pregnant and lactating ruminants have a high demand for amino acids for protein deposition, and for both amino acids and propionate for glucose synthesis. The central importance of glucose is indicated by the fact that about 20% of the energy of the digestible nutrients available to mature sheep is synthesised into glucose and enters the glucose pool in blood (Judson and Leng 1968). Similarly, in growing steers and dry or lactating cows with highly variable feed intakes, around 23% of the digestible energy appears as glucose in blood (see Figure 4.5) (Herbein et al. 1978). The need for glucose may be increased on low-fat diets in order to provide the necessary co-factors for fat synthesis. The partitioning of amino acids between protein deposition and deamination to provide glucose precursors may therefore depend upon the availability of LCFAs from the diet.
 |
|
Figure 4.5 Glucose turnover rate in relation to the digestible energy intake (Source: Herbein et al. 1978) |
Essential amino acids are defined as those that are required by the animal but are not synthesised by animal tissues and thus must be obtained by absorption from digested feed or microbial protein. In productive animals, amino acids absorbed from the digestive tract may be used largely in tissue synthesis, but those that can give rise to three-carbon metabolites (eg. alanine, which is deaminated to pyruvate) will contribute to the availability of glucogenic energy and at times may be preferentially diverted to glucose synthesis.
The contribution of amino acids to gluconeogenesis in ruminants is probably low because of competition for amino acids for protein synthesis. However, in the mature, non-productive ruminant, all the amino acids are deaminated and contribute to the net availability of oxidation energy (C2 energy) and synthesis energy (C3 energy). The pathways of metabolism of the amino acids are shown in Figure 4.6.
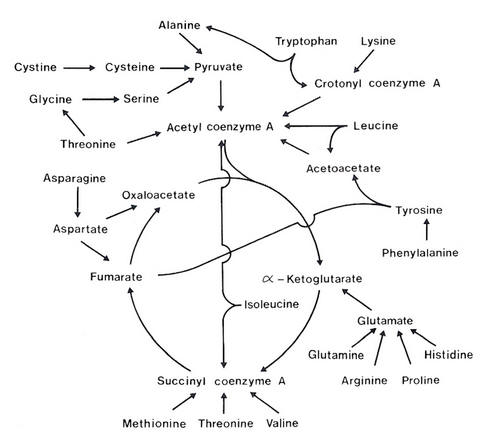 |
| Figure 4.6 Outline of the fate of the carbon skeletons of the amino acids when used as fuels. |
Long-chain fatty acids (LCFAs), released from dietary fat by hydrolysis in the rumen, are hydrogenated to give saturated fatty acids but are otherwise unchanged. These compounds are absorbed efficiently in the small intestine. Depending on the diet, fat may contribute approximately 7 to 10% of the digestible energy of the ration.
Metabolism of LCFAs may provide some of the acetate entering blood, particularly in ruminants at maintenance levels of feeding. Fatty acids may also be incorporated directly into body tissues and milk fat. The proportion of unsaturated LCFAs in the adipose tissues increases when they are added directly to the abomasum (Ogilvie et al. 1961). This is supported by the studies of Scott (1970), who found that the proportion of unsaturated fatty acids in adipose tissues increased with only 3 to 4 weeks of feeding unsaturated fats protected from hydrogenation in the rumen.
The synthesis of LCFAs from acetate is likely to be increased where the products absorbed from the alimentary tract have a low protein-to-energy ratio, and some animals tend to lay down more fat when fed diets from which little dietary protein is digested in the intestines.
Lindsay (1970) demonstrated that there is negligible synthesis of LCFAs from acetate in sheep on a maintenance ration. He also gave further evidence to support the concept that lipids of adipose tissue arise from circulating LCFAs of dietary origin (Lindsay 1983). However, the presence of enzymes for fatty acid synthesis in subcutaneous and other tissues clearly indicates that long chain fatty acids are synthesised de novo (see Smith and Prior 1986).
Some animals appear to use their ability to synthesise fat in order to balance the availability of nutrients for production. By laying down fat rapidly in an organ or secreting it in milk, the balance of amino acids to energy available may be altered in favour of either proteinaceous growth or milk production. The high fat content of buffalo milk is one example of an adaptation which allows the animal to match the nutrient requirements to the availability of nutrients. Possibly the fat-tailed sheep uses the deposits of fat in the tail to do the same thing.
Lipogenesis requires 148 moles of ATP per mole of tripalmitin synthesised from acetate and glycerol. In theory, to provide ATP for fatty acid synthesis, substrate equivalent to 4.2 moles of acetate or 2.3 moles of propionate or 1.9 moles of butyrate must be oxidised per mole of palmitate synthesised from acetyl CoA. However, if the pathways of catabolism are associated with prior conversion to other substrates such as glucose or ketone bodies, the efficiency of utilisation is less.
The interrelationships are illustrated in Figure 4.7.
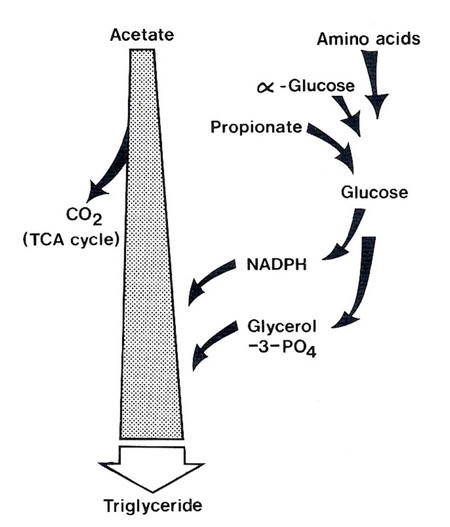 |
| Figure 4.7 Diagram of the relationships between availability of glucogenic precursors and pattern of acetate utilisation. |
The synthesis of palmitate from acetyl CoA is shown below.
8 acetyl-S-CoA + 14 NADPH + 14H+ + 7 ATP + H2O palmitic acid + 8 CoA + 14 NADP + 7 ADP + 7P
The NADPH is formed from glucose metabolism via the phosphogluconate pathway (or pentose phosphate pathway) in which 1 mole of glucose-6-phosphate is oxidised to CO2 and NADP is reduced.
glucose-6-P + 12 NADP + 7 H2O 6 CO2 + 12 NADPH + 12 H+ + P
Thus for every 8 moles of acetate converted to 1 mole of palmitic acid, 14 moles of NADPH must be provided by the oxidation of 1.17 moles of glucose via the phosphogluconate pathway. In addition, 1 mole of glycerol-phosphate, formed from glucose, is needed to esterify 3 moles of palmitic acid. The overall reaction for the synthesis of tripalmitin is as follows:
24 acetyl-S-CoA + 42 NADPH 3 palmitic acid + 42 NADP 3.5 glucose 21 CO2 + 42 NADPH 0.5 glucose 1 glycerol
Thus where glucose provides the NADPH, 4 moles of glucose are oxidised to synthesise 1 mole of tripalmitin or 89g of glucose are oxidised to form 100g of fat.
There is evidence (Baumann and Davis 1975; Moore and Christie 1981; Oldham 1983) that up to 50% of the NADPH needed for synthesis of LCFAs may arise in mammary tissue through reactions other than the phosphogluconate pathway (eg. dehydrogenation of isocitrate to 2-oxoglutarate). Subcutaneous adipose tissue also has similar mechanisms for generating NADPH (Smith and Prior 1980) but when glucose is present the phosphogluconate pathway appears to be the one by which at least 66% of the NADPH is produced. However, the contribution to NADPH generation of the alternative pathways has not been truly quantified (Vernon 1981). The alternative pathways of NADPH production are outlined in Figure 4.8.
 |
| Figure 4.8 Pathways of NADPH generation. |
Although the relative contributions of the two pathways of NADPH generation have not been truly quantified some theoretical calculations suggest that the phosphogluconate pathways of oxidation of glucose must predominate. The presence of the isocitrate dehydrogenase reaction for NADPH generation might appear, at first sight, to eliminate the need for oxidation of glucose and therefore conserves glucose. This has led Thornton and Tume (1984, 1987) to suggest that:
``there appears to be sufficient capacity and flexibility in the NADPH generation systems to meet the demands of lipogenesis; indeed NADPH synthesis may be consequential rather than causal for lipogenesis"
This statement, however, does not take into account the need for a balanced supply of ATP and NADPH in this tissue which specialises in only fat synthesis. Nor does it explain the evidence from growth studies that strongly suggests glucose is a limiting nutrient. It would be a great advantage to optimise acetate utilization as an energy and substrate source for fat synthesis and minimise the need for glucose particularly if blood glucose concentration is low. The presence of both pathways provides the necessary flexibility. The advantages of having both systems of generation of NADPH in the same cell become apparent from stoichiometric relationships in fat synthesis.
These relationships assume glucose or acetate each alone provides the NADPH or that both are used such that NADPH and ATP requirements are provided in stoichiometric amounts from the simultaneous metabolism of acetate and glucose.
[A.] Assuming all NADPH arises from glucose oxidation in the phosphogluconate pathway the following relationships exist:
| Step |
Reaction |
ATP generated |
| 1 | 24 acetate + 24(CoA-SH) + 48 ATP 24 acetyl-S-CoA + 48 | -48 |
| 2 | 24(acetyl-S-CoA) + 21 ATP + 42 NADPH 3 palmitate + 21(ADP + P) + 42 NADP + 24(CoA-SH) | -21 |
| 3 | 3 palmitate + 6 ATP + 3(CoA-SH) 3 palmitoyl CoA + 6(ADP + P) | -6 |
| 4 | 3 palmitoyl CoA + glycerol-3-PO4 1 tripalmitin 5. 0.5 glucose + ATP + NADH 1 glycerol-3-PO4 + (ADP + P) + NAD | |
| 5 | 3 palmitoyl CoA + glycerol-3-PO4 1 tripalmitin 5. 0.5 glucose + ATP + NADH 1 glycerol-3-PO4 + (ADP + P) + NAD | -4 |
| 6 | 3.5 glucose + 42NADP 21CO2 + 42 NADPH | |
| 8 propionate + 16 ATP 4 glucose + 16(ADP + P) | -16 | |
|
Balance |
-95 |
From these calculations, to synthesise a triglyceride such as tripalmitin the overall reactions would require 95 ATP and the metabolism of 4 glucose. The 95 ATP could arise from 9.5 acetate oxidised in the TCA cycle.
The overall stoichiometry is therefore:
33.5 acetate + 8 propionate 1 tripalmitin.
[B.] Assuming all NADPH arises from isocitric dehydrogenase reaction in the TCA cycle:
| Step |
Reaction |
ATP generated |
| 1-5 | Reactions 1-5 remain the same | -79 |
| 6 | 42 acetate + 294 ADP + 294 P 42 NADPH + 294 ATP | +294 |
| 3 | 3 palmitate + 6 ATP + 3(CoA-SH) 3 palmitoyl CoA + 6(ADP + P) | -6 |
|
Balance |
+215 |
The overall stoichiometry is therefore:
66 acetate + 1 propionate --> 1 tripalmitate
This pathway would produce an excess of ATP which, in the mammary gland, could be utilized for milk protein synthesis, however, in the specialised adipocyte such sinks appear to be absent and the pathway may be impossible to sustain.
[C.] Assuming NADPH arises in both pathways such that ATP and NADPH generation are balanced to requirements:
| Step |
Reaction |
ATP generated |
| 1-5 | Reactions 1-5 remain the same | -79 |
| 10 | 13 acetate + 91 ADP + 91 P 13 NADPH + 91 ATP | +91 |
| 3 | 5.4 propionate + 11.6 ATP 2.92 glucose + 11.6(ADP + P) | -11.6 |
|
Balance |
+0.04 |
In this example the overall stoichiometry is
37 acetate + 5.84 propionate 1 tripalmitin
Thus the presence of both enzyme systems allows maximum use of acetate with minimum oxidation of glucose but glucose still remains the major proportion of the substrate for NADPH generation.
A comparison of the ratio of acetogenic to glucogenic compounds needed for fat synthesis and the ratios produced in the rumen indicates that these are relatively imbalanced for fat synthesis. Using the data in Table 3.5 for VFA proportions in the rumen of ruminants on different diets, allows the following comparisons to be made:
In fat synthesis (assuming glucose oxidation provides NADPH) the ratio of substrate requirements (ie. acetic/propionic acid)= 100:23
In fat synthesis, (minimising glucose oxidation and optimising acetate oxidation and generation of NADPH from isocitric dehydrogenase reaction), the acetic/propionic acid requirements
= 100:16
In fat synthesis (using acetate to generate the NADPH and surplus ATP being used for other synthesis (eg. milk protein)) the acetic to propionic acid requirements
= 100:1.5
The ratio of acetogenic compounds (acetate plus 2 x butyrate) to propionate produced in the rumen of animals given diets based on:
grain= 100:75
low digestibility forage= 100:16
molasses= 100:21
These calculations indicate that any obligatory uptake of glucose (eg. for brain metabolism or for growth of the foetus and production of milk) imbalances the nutrients for fat synthesis in adipocytes and creates a surplus of acetogenic substrate when ruminants are fed on low digestibility forages or sugar-based diets but this is unlikely on a grain-based diet. The surplus of acetogenic substrate will depend on the requirements for oxidative energy which in turn is influenced by climate, work load and productive state.
It appears that the presence of alternative pathways for the generation of NADPH in adipose tissue allows optimal use of acetate for fat synthesis and minimises the requirements for glucose. Approximately 70% of the NADPH must arise from glucose oxidation in the phosphogluconate pathway, the rest from acetate. Thus, in adipose tissue approximately 0.65g glucose are required per g of fat synthesised. On the other hand about 50% of the NADPH for fat synthesis may be synthesized in the mammary gland via acetate utilization where the excess ATP can be used for other synthetic reactions (ie. protein and lactose synthesis). The high fat milk of buffaloes has been suggested as a major adaptation to low protein, low digestibility, forage-based (and therefore low glucogenic potential) diets. If there are adequate ATP `sinks' in buffalo mammary gland metabolism then the high fat milk is produced with acetate being the major substrate for both ATP and NADPH generation and glucose utilisation would be at a minimum. This work effectively allows the buffalo to balance its nutrient for metabolism in the rest of the body.
As discussed in Chapter 3, there is strong evidence that body fat arises largely from dietary fat in animals on diets that contain appreciable amounts of fat. Intramuscular fat may be synthesised de novo and the LCFAs possibly arise from glucose and lactate (Smith and Prior 1986). Milk fat is synthesised from both VFAs and dietary LCFAs.
The relationships between microbial protein produced to VFA energy (P/E), glucogenic energy to microbial protein (G/P) in the rumen at different microbial growth efficiencies (YATP). The values are derived from the data in Table 3.10.
There are four situations in which the synthesis of fat is from short-chain VFAs rather than from LCFAs. These include:
When the ratio of protein to energy (P/E) in the diet is low and fat deposition becomes an energy sink
When fat is a small proportion of the diet, as is the case with diets based on molasses and cereal straws
When the diet is composed largely of grain, and propionate production is excessively high. Under these conditions large amounts of fat that contain both even and odd number of carbon units are synthesised and this leads to oily or soft fat (Duncan et al. 1974)
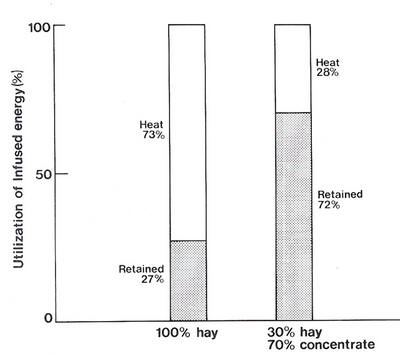
When acetate availability is increased suddenly such as by intravenous infusion. In this case considerable energy may be used to synthesise fat, resulting in increased heat production.
The nutrients for metabolism arise from the products of rumen fermentation and digestion of bypass nutrients and endogenous secretions, and from mobilised body tissues. The interrelationships among these sources are shown in Figure 4.9.
 |
|
Figure 4.9 Origin of principal metabolites in ruminants. |
The need for bypass nutrients and the extent to which body tissue is mobilised is dependent on the nature of the rumen fermentation (ie. YATP and proportions of VFAs) and the productive state of the animal (eg. work versus milk production). It is therefore essential (particularly for diets that are digested mainly in the rumen) that the relative availability of the important metabolites is known. For these reasons the relationships among amino acids, glucogenic energy and VFA energy have been calculated for different microbial growth efficiencies (YATP) and patterns of VFA production (Table 4.1).
|
Table 4.1: The relationships between microbial protein produced to VFA energy (P/E), glucogenic energy to microbial protein (G/P) in the rumen at different microbial growth efficiencies (YATP). The values are derived from the data in Table 3.10. |
|||||||||||
|
|
|
VFA energy |
Propionate energy |
P /E ratio |
G/P ratio |
G/E ratio |
|||||
|
|
|
(MJ/d) |
(MJ/d) |
(g/MJ) |
(kJ/g) |
(%) |
|||||
|
YATP |
Microbial protein (g/d) |
LP |
HP |
LP |
HP |
LP |
HP |
LP |
HP |
LP |
HP |
|
8 |
500 |
41 |
43 |
11 |
17 |
12 |
12 |
22 |
34 |
27 |
38 |
|
14 |
800 |
34 |
36 |
9 |
14 |
25 |
22 |
11 |
18 |
27 |
38 |
|
19 |
1010 |
30 |
32 |
8 |
12 |
34 |
32 |
8 |
12 |
27 |
38 |
|
2.5 |
1210 |
26 |
27 |
7 |
10 |
47 |
45 |
6 |
8 |
27 |
38 |
|
LP = fermentative pattern, 70:20:10 for acetic: propionic: butyric acids. HP - fermentative pattern, 60:30:10. |
|||||||||||
The data in Table 4.1 were calculated for two patterns of fermentation in the rumen. The 70:20:10 pattern (ie. acetate:propionate:butyrate) represents that occurring in ruminants fed fibrous crop residues and tropical pastures and the 60:30:10 pattern represents that found when concentrates comprise a large proportion of the diet (40-60%). Sugar-rich feeds are similar to fibrous feeds with respect to propionate production but usually produce a larger proportion of butyrate (see Table 3.5).
As the efficiency of microbial growth increases, the amount of glucogenic energy potentially derived from propionate decreases relative to that potentially derived from protein. The ratio of glucogenic energy relative to both protein and total VFA energy increases with larger proportions of propionate in the VFAs in the rumen.
A mature animal at rest expends most of its energy to support basal metabolism but an ox working at a steady rate, eg. ploughing, uses nutrients to generate energy as ATP at 6 to 10 times the rate at rest. High-energy phosphate (ATP) is the major energy currency of the body but other compounds such as phosphocreatine are of importance as a sustainable source of phosphate-bond energy to replenish ATP in actively working muscles.
The source of all potential energy in skeletal muscle is ultimately the absorbed products of digestion. The digestion of feed and the metabolism of the end-products of fermentation in ruminants have been discussed earlier.
Draught animals in developing countries are fed largely on crop residues. These may be supplemented with byproducts, grazing on communal lands and grass cut from roadsides. Generally, draught animals are fed on those feed resources considered to be the least nutritious; the ``better quality" feeds tend to be given to the ``more productive" females or young animals or both. Throughout the world the majority of draught animals probably depend on cereal straw or cane tops or a mixture of the two.
As discussed previously, on these diets rumen fermentation is limited primarily by the availability of fermentable N, with the result that microbial growth and fibre breakdown are slow. Thus, feed intake is less than 2.0% of liveweight, the digestibility of the feed is usually less than 40% and the ratio of protein to energy in the products absorbed is low (see Chapter 3).
Table 4.2 shows the nutrients likely to become available for metabolism in a draught animal given straw or straw plus urea. The calculations are based on the model for fermentative digestion discussed in Chapter 3.
|
Table 4.2: Theoretical availability of metabolisable nutrients from fermentative digestion in the rumen in a draught animal (500 kg liveweight) consuming 10 kg of straw without supplementation or supplemented with urea-minerals. It is assumed that in the unsupplemented animal the digestibility of straw in the rumen is 40% and the efficiency of microbial growth is low (ie. YATP = 8) and that supplementation with urea/minerals increases digestibility to 50% and the microbial growth yield (Y AT p) to 14. Intake of straw is stimulated to 14 kg/d by urea supplementation. |
||
|
|
Straw |
Straw +urea |
|
Digestible straw intake |
|
|
|
Kg |
4 |
7 |
|
MJ |
70 |
123 |
|
VFA produced (MJ) |
|
|
|
(a) Acetic |
22 |
34 |
|
(b) Propionic |
11 |
16 |
|
(c) Butyric |
8 |
11 |
|
Energy losses |
|
|
|
Methane (MJ) |
9 |
15 |
|
Heat (MJ) |
6 |
9 |
|
d) Dietary LCFAs (MJ) |
4 |
6 |
|
Microbial cells (kg) |
0.83 |
2.33 |
|
(e) Digestible microbial cells |
|
|
|
(kg) |
0.66 |
1.86 |
|
(MJ) |
11 |
31 |
|
Energy
available
for
metabolism |
56 |
98 |
|
Source: Leng 1985 |
||
The products of digestion are modified by the gut epithelium and the liver such that the circulating substrates available for muscle metabolism are acetate, ketone bodies, LCFAs and glucose. Additional sources of energy that can be mobilised include the fat of adipose tissue and glycogen and fat present in almost all tissues. Resting muscle has reserves of fat and glycogen which can be oxidised directly in muscle metabolism.
Skeletal muscle represents some 25% of the body mass of ruminants and probably more in the working animal. At rest it has a relatively low metabolic rate but in heavily working animals it may account for as much as 90% of the oxygen consumption. The need for extra feed in working animals depends on the increase in overall metabolic rate. An approximation of the extra requirements can be obtained by calculating the effects of different activities on the metabolic rate. Ploughing for 6 hours daily may increase metabolic rate by a factor of four, exercise doubles metabolic rate, whereas the minimal activity of the tethered animal (mainly eating and ruminating) increases metabolic rate by only 50% over the basal rate (see Table 4.3).
|
Table 4.3: Calculation of the effects of various activities on the heat production of an ox, kept tethered most of the day, walked alongside a working ox or ploughing for six hours. |
||||||
|
|
Sleeping! lounging (1)* |
Eating! ruminating |
Light workl (3) |
Heavy work (10) |
Total hourly equivalent of BMR2 |
Multiples of BMR |
|
Non-working ox |
|
|
|
|
||
|
Time spent (h) |
12 |
11 |
1 |
0 |
|
|
|
BMR equivalents (h) |
12 |
22 |
3 |
0 |
27 |
1.5 |
|
Ox walking as team mate |
|
|
|
|||
|
Time spent (h) |
6 |
11 |
7 |
0 |
|
|
|
BMR equivalents (h) |
6 |
22 |
21 |
0 |
49 |
2.0 |
|
Working ox (ploughing) |
|
|
|
|||
|
Time' spent (h) |
6 |
11 |
1 |
6 |
|
|
|
BMR equivalents (h) |
6 |
22 |
3 |
60 |
91 |
3.8 |
|
*
Figures
in brackets
are the
energy
cost
of
the activity
related
to
basal metabolism.
|
||||||
Work is a product of muscle contraction which is brought about by the action of calcium ions in combination with the conversion of ATP to ADP, which provides the energy. The sequence of events is as follows (see McGilvery and Goldstein 1983):
Nerve impulses stimulate the membrane surrounding muscle fibres (sarcoplasmic reticulum) to secrete calcium ions into the fluid bathing the muscle fibres, raising the calcium concentration by a factor of 100 (from 0.1 to 10 M)
Calcium reacts with a specific protein and causes the thick and thin filaments of muscle fibres to slide over each other, shortening the muscle (see Figure 4.10)
ATP is converted to ADP to provide energy and heat is generated
Contraction persists until the concentration of calcium falls, which happens when the nerve impulses cease, and the muscle then relaxes.
 |
| Figure 4.10 Diagrammatic representation of the way in which the thin and thick filaments of muscle fibres slide over one another and cause contraction of the muscle (Source: White et al. 1978.). |
In most animals, skeletal muscles are comprised of at least three types of fibres. Two are red and the other white. The white fibres use glycogen and glucose almost exclusively. The red fibres contain concentrated haemoproteins, particularly myoglobin, and thus have a very high capacity to accept oxygen from blood and can oxidise a wide range of circulating substrates.
One type of red fibre contracts slowly and steadily and can maintain tension over a long period while the other type of red fibre and the white fibres contract rapidly. In the draught animal, because of the slow and steady gait, the slowly contracting red fibres should be predominant in working muscle.
The power of a muscle contraction depends on the availability of ATP and its rate of regeneration from ADP through oxidative phosphorylation.
Muscle has a reserve of high-energy phosphate bonds in the form of phosphocreatine, which is used during periods of high rates of work and is replenished when the muscle is at rest or working at a moderate rate.
Phosphocreatine is converted to creatine and ADP to ATP under the action of creatine phosphatase. This enzyme is present in sufficiently high concentrations to maintain ATP at a high concentration until the muscle is exhausted. Even during heavy work, the concentration of ATP is almost always more than 75% of that at rest. It is only when a working muscle is at the point of exhaustion that ATP levels fall. The generation of ATP and phosphocreatine is shown in Figure 4.11.
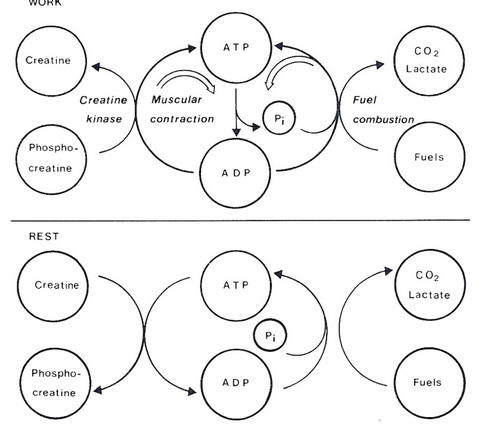 |
| Figure 4.11 In working muscle, hydrolysis of ATP to ADP provides the energy needed for the muscle to contract. If there is a shortage of ATP from oxidation of substrates, ATP is generated from phosphocreatine. When work ceases ATP generated from oxidation of substrates is used to regenerate phosphocreatine. |
Resting muscle requires a constant supply of ATP for its basal metabolism and to regenerate phosphocreatine used during contraction. The energy requirement of muscle can increase 20- to 200-fold almost instantaneously. The rate at which ATP is formed by oxidation of carbohydrate, ketone bodies and short-chain or long-chain fatty acids is adequate to meet the needs of resting muscle but is not always fast enough to meet the needs of working muscle. The maximal rate of oxygen uptake is considerably less than that required when muscles work at very high rates. Under these circumstances muscles depend on anaerobic metabolism of glucose to provide ATP and this leads quickly to fatigue. In the case of draught cattle and buffaloes, work is unlikely to be so intense that appreciable anaerobic metabolism of glucose occurs.
The work capability of a ruminant may be below the level at which glucose would be used via glycolysis since the availability of glucose to the animals is limited (Leng 1970b), although the mature animal has more glucose available for work than the growing or lactating ruminant. In a working animal that is not gaining weight all the absorbed amino acids will be metabolised (largely in the liver) to give rise to acetate, ketone bodies or glucose precursors.
For example, in a draught animal (500 kg liveweight) consuming 10 kg of straw (or 14 kg of straw when supplemented with urea) (Table 4.2), the glucose precursors available are propionate and digested microbial protein. A major effect of adding urea to the diet is to increase the gluconeogenic potential of absorbed nutrients by almost 100% (Table 4.4). Fat from rumen microbes is similarly increased. The availability of glucose and LCFA may be a primary constraint to the use of lactating cows for work (see later), since the demand for glucose is higher in lactating cows than in non-lactating animals.
|
Table 4.4: The theoretical balance of nutrients available to a draught buffalo or cow (500kg liveweight) given a straw-based diet with or without adequate urea supplementation and allowed free restricted access to straw. The values in the tables are approximations of the changes in the balance of nutrients that can occur when the animals on a straw-based diet are supplemented with urea |
|||
|
|
Ad libitum |
Restricted |
|
|
|
-urea |
+urea |
+urea |
|
Straw intake (kg) |
10 |
14 |
10 |
|
Digestible straw |
|
|
|
|
intake (kg) |
4 |
7 |
5 |
|
Nutrients available |
|
|
|
|
VFA (MJ) |
41 |
61 |
43 |
|
Protein (g) |
400 |
1010 |
717 |
|
LCFA (g)* |
180 |
383 |
265 |
|
Glucose synthesis |
|
|
|
|
potential (g)# |
859 |
1500 |
1069 |
|
Assumptions:
(see
Table
4.2):
|
|||
Figure 4.12 shows a diagrammatic representation of the organisation of muscle cells. The mitochondria are closely associated with muscle fibres and ATP formed in them is released into the cytoplasm for muscle contraction or the resynthesis of phosphocreatine. The metabolism of the substrates that arrive in blood at the muscle cells is discussed below.
 |
| Figure 4.12 Organisation of muscle cells (Source: White et al. 1978). |
Long-chain fatty acids (LCFAs) are absorbed into the cell from extracellular fluid. Those used for substrate are mainly the C16 and C18 acids. Whatever the destination, the LCFAs are first combined with CoA to form a highly polar thiol ester which is highly soluble in the aqueous phase of the cell. In the mitochondria the acyl groups are used as fuel for oxidative phosphorylation (ATP formation). The LCFAs are transported into the mitochondria and are oxidised by a stepwise removal of acetyl CoA units which are then completely oxidised in the tricarboxylic acid cycle.
The outline of oxidations of palmitate and oleate are shown below:
C16H31O2 + 23O2 + 129ADP 16CO2 + 129ATP C18H33O2 + 25O2 + 144ADP 18CO2 + 144ATP
Acetate is rapidly converted to acetyl CoA by enzymes in both cytosol and on the mitochondrial matrix and therefore should be readily oxidised, producing 12 ATP, of which 2 ATP are used for acetylation of CoA.
Ketone bodies (acetoacetate and D-3-hydroxy-butyrate) are highly soluble and easily transferred into skeletal muscle. These two compounds are metabolised via acetyl CoA.
Glucose is either metabolised to lactic acid or completely oxidised. The glycolytic enzymes are present in solution in the cytosol and convert glucose to pyruvate or lactate, depending on the relative oxygen tension. Pyruvate can be totally oxidised via acetyl CoA.
glucose + O2 -->2 pyruvate + 6 ATP
glucose + 6O2 + 35.5ADP --> 6CO2 + 6H2O + 35.5ATP
The polar glucose molecule does not cross the cell membrane freely and this must be facilitated by specific carrier proteins. The carriers have no known controls other than the concentration gradient, but the diffusion of glucose is governed, at least partly, by the level of insulin in the blood. The pancreas increases its output of insulin in response to hyperglycaemia brought about by the release of glucagon, which is stimulated by exercise (see Pethick et al. 1984). Hyperglycaemia is often observed when muscles are working relatively hard (ie. sheep walking on a treadmill at 4.0m/second and on a 10o slope; see Bird et al. 1981).
Repeated contractions of the muscle in some way increase the diffusion of glucose into muscle cells, at least in ruminants. Thus there will always be a drain on the available glucose in working animals.
Comparisons of the ATP yield per unit of oxygen consumed show that acetate oxidation is associated with the most inefficient use of ATP and therefore more heat per unit of work is generated when acetate is the metabolite being oxidised (Table 4.5).
|
Table 4.5: ATP yield and oxygen uptake from combustion of the major metabolites in blood |
||
|
Substrate |
ATP yield/mole |
ATP/O2 |
|
B-hydroxybutyrate |
23 |
2.89 |
|
Palmitate |
129 |
2.80 |
|
.Oleate |
144 |
2.82 |
|
Acetate |
10 |
2.50 |
|
Glucose |
36 |
2.95 |
There appear to have been no studies on substrate oxidation in working muscle of cattle or sheep under sustained intense work loads. In the following discussion the trends in substrate use between resting and exercising muscles are therefore presumed to indicate the substrates that are most likely to be used by heavily exercising muscle.
The substrates arriving in the blood to skeletal muscle are mainly acetate, ketone bodies, LCFAs and glucose. Amino acids are a potential but minor source of energy.
The substrates in skeletal muscle that can be mobilised for oxidation include glycogen and fat. Protein or amino acids are mobilised but are unlikely to provide a significant proportion of the substrate for heavily exercising muscle.
The uptake of acetate is low but linearly related to its concentration in arterial blood in the hind limb of sheep and cattle (Bell 1980). The rates of use and oxidation of stearic, palmitic and oleic acid, were also linearly related to their concentrations in the arterial blood supplying skeletal muscle in the pregnant ewe (Pethick et al. 1983). The uptake of ketone bodies by the muscles of the hind limb is higher in ruminants than non-ruminants (Jarrett et al. 1976) and directly related to arterial concentrations over a range of normal blood values (Bell 1980) but is severely limited at levels above 3 to 4 mM (Pethick and Lindsay 1982 a,b).
In fed ewes, glucose oxidation accounts for an appreciable proportion of the total amount of oxygen taken up by hind limb muscles (Table 4.6). The uptake of glucose by muscle appears to be dependent on the physiological state of the animal (Table 4.6)(see Pethick et al. 1984).
|
Table 4.6: Arterial concentration (A-conc, mM) of metabolite$ and their apparent contribution to oxygen uptake (%02) by skeletal muscles of the hind limb of sheep at rest and in various physiological conditions |
||||||||||
|
|
|
|
Starved |
Fed pregnant |
Starved |
Lactating |
||||
|
|
Fed sheep |
sheep (6 days) |
sheep |
|
pregnant sheep |
fed sheep |
||||
|
Substrate |
A-conc |
%02 |
A-conc |
%02 |
A-conc |
%02 |
A-conc |
%02 |
A-conc |
%02 |
|
LCFA |
0.1 |
10 |
1.4 |
80 |
0.8 |
52 |
1.6 |
91 |
|
|
|
Ketone" bodies |
0.4 |
15 |
1.2 |
36 |
1.0 |
19 |
3.2 |
48 |
0.4 |
16 |
|
Acetate |
1.2 |
35 |
0.1 |
I |
1.2 |
34 |
10.2 |
1 |
1.2-2.4 |
22-36 |
|
Glucose |
2.9-3.8 |
44 |
2.3 |
0 |
2.5 |
35 |
1.4 |
10 |
3.0 |
32 |
|
Source: Collated by Pethick et al.(1984) and Pet hick and Lindsay (1982a,b). |
||||||||||
The conclusions from the above discussion are that the contribution of various substrates to energy required for muscle in non-exercising ruminants is related to their concentrations in arterial blood. Nutrition and physiological state affect the concentration of the substrates in the blood and therefore the contribution of individual substrates to muscle metabolism. Acetate and glucose appear to be important substrates for resting skeletal muscle; ketone bodies and free fatty acids of dietary or adipose-tissue origin are also used (Table 4.6; Figure 4.13; Figure 4.14).
 |
 |
| Figure 4.13 LCFA metabolism contributed most to uptake of oxygen in working muscle. The results are for sheep at maintenance (m) and fed 1.5 maintenance (1.5m) (Source: Pethick 1984). | Figure 4.14 Effects of exercise on utilisation of glucose
and free fatty acids in the muscle of sheep (Source: Pethick 1984) |
Bird et al. (1981), in a comprehensive study of substrate use in the hind limb of sheep walking on a treadmill, found that exercise caused a 6- to 7-fold increase in the amount of oxygen taken up by the muscles of the hind limb, which followed closely the measured increase in blood flow rate. The oxygen carrying capacity of the arterial blood also increased through a greater density of red blood cells and also by an increase in the affinity of the red blood cells for oxygen. Working for 60 minutes (ie. walking at 0.7 m/second on 10o slope) caused hyperglycaemia, hyperlacticacidaemia and mobilisation of LCFAs from adipose tissue. The muscles took up more LCFAs and glucose but most of the oxygen taken up by the muscle was used in LCFA catabolism (see Figure 4.13; Table 4.6; Bird et al. 1981; Pethick et al. 1984; Pethick and Chong 1985).
Pethick (1984) found that muscle in fed, non-productive sheep used approximately 1.25 mM of glucose/hour per kilogram of muscle, but muscle in fasted pregnant sheep used only 0.3 mM of glucose/hour per kg of muscle (see Pethick 1984).
The uptake of glucose by muscle is intriguing because of the general concept of glucose being in limited supply in productive ruminants. An increased requirement for glucose may therefore be an important constraint to work, particularly if growing animals or productive females are to be used for animal traction. For this reason glucose utilisation is discussed in more detail.
Judson et al. (1976) found that the amount of glucose passing through the glucose pool increased from 80 mg/min to 151 mg/min in exercising sheep and attributed the increase to extra gluconeogenesis. However, quite a lot of glucose carbon is recycled through lactate in exercising sheep as shown by Pethick (1984) and mobilisation of glycogen reserves would seem to be an obvious mechanism for supplying some of the extra glucose.
Glucose uptake by muscle increased with exercise (walking at 5 km/hour), as did the uptake of FFAs (see Figure 4.14; Pethick 1984). Assuming that the muscle mass in a 40 kg sheep is about 25% of body weight (ie. 10 kg), then in 2 hours muscle used 4.5g of glucose at rest in fed animals, 0.72g in a fasted pregnant animal, but as much as 12.6g in a sheep walking on a treadmill at 5km/hour. In maintenance-fed sheep, approximately 100mg of glucose is synthesised per minute, which uses a large proportion of the glucose precursors available from the digestive tract (Leng 1970b). Therefore, in the walking sheep a large proportion of the glucose used for work must be obtained by mobilising body reserves. As the liver contains about 5g of glycogen/100g and skeletal muscle 1 to 2g of glycogen/100g, these are potential sources of the glucose for muscle metabolism in the short term. The other sources are unused glucogenic compounds and glycerol from mobilised fat, and glucogenic amino acids.
Two hours work increased glucose use by only 8.1g/day in sheep, provided that glucose use was not increased during the recovery period. This is only 8-10% more glucose than is normally synthesised and should be easily met by glycogen mobilisation during the work period. If glycogen is mobilised its recovery in liver or muscle necessitates increased gluconeogenesis in the period following exercise. It is also possible that during work, glucose use in peripheral tissues is reduced. This may be a reasonable assumption since peripheral tissues use less glucose in lactating goats than in non-lactating goats (Annison and Linzell 1964).
The physiological state of the animal affects the amount of glucose that can be used by the muscle mass. It is well established that the lactating mammary gland and the pregnant uterus use a large proportion of the available glucose. Skeletal muscle appears to use less glucose when the requirements for glucose in other parts of the body are high (Table 4.6). The major conservation mechanism appears to be incomplete oxidation of glucose, the lactate released being recycled to glucose via the liver. There are some suggestions that glucose carbon can be recycled through alanine and glutamine (Lindsay 1980). It appears likely that glucose carbon will be recycled to a greater extent in an intensely working animal than in a resting animal.
Knowledge of the uptake of substrate by skeletal muscle relies on a few publications based largely on metabolism in the hind limb of sheep or cattle. Metabolism in muscle has only been studied under light to moderate exercise (1 to 2 hours walking on the flat or on a slight incline) in both species. No studies appear to have been conducted on the uptake of substrate by muscles of working oxen (ie. 4 to 6 hours ploughing). Thus, the information on the use of substrate by skeletal muscle, as indicated by the lightly working hind-limb muscle, must be taken as only an indication of what might be happening in the whole animal.
During heavy work, which increases an animal's basal metabolic rate 4-fold, the only substrates that are available in sufficient quantities to supplement the products of digestion and their metabolites (LCFAs, acetate and ketone bodies) are the LCFAs mobilised from adipose tissue or provided in high concentrations by a feed supplement. Oxidation of glucose by skeletal muscle over 6 hours may increase daily glucose use by say 25-30%, which can be readily compensated for by synthesising glucose from amino acids or by increasing feed intake by 30 to 40% (eg. by feeding urea, see Table 4.2).
Throughout evolution, ruminants have had to migrate over long distances, often working hard to gather food. However, they have been able to produce and raise viable offspring. Fat stored during non-productive periods is mobilised in times of need.
In traditional agricultural systems the male animal is kept for traction, presumably because of its low demand for nutrients during periods of no work (when the animal fattens) and its ability to mobilise body reserves during the work season. However, the male draught animal almost always competes for the available feed resources with productive females. As a result in some countries where there is a chronic feed shortage (eg. Bangladesh) females are replacing males as draught animals (Dolberg 1983).
As an animal's work-load increases, LCFAs are oxidised increasingly to generate ATP accounting for 80 to 90% of the oxygen taken up by working muscles (Bird et al. 1981). Glucose oxidation appears to provide some of the energy for muscle contraction, and may be of quantitative importance in animals working intensely (4 to 6 hours/day), which may use 50% more glucose than resting animals. This will be a significant drain on glucose supplies when there is a competing need for glucose for production of milk solids.
Protein or amino acids do not appear to be used by muscles to any extent. In lactating sheep, acetate is used less by muscles and is used more by the mammary gland (Pethick and Lindsay 1982a). Thus in a working cow, the availabilities of glucose and LCFAs are likely to be the primary limitations to milk production. Amino acids may be deficient if the need for glucose synthesis takes precedence over other metabolic functions. It appears that if a cow is to work without its milk yield being reduced it will require feed supplements that increase the availability of glucose and provide LCFAs.
Pregnancy does not place a high demand on nutrients until the last trimester and provided animals can be rested towards the end of pregnancy, work should be easily accommodated. The data of Lindsay et al. (1982) emphasise the type of supplements that would be beneficial to animals on a straw-based diet (see Table 9.8). Since glucose is a major source of energy for the growing foetus, a working pregnant animal would benefit from a source of glucogenic energy. This could be provided by increasing propionate production from rumen fermentation or by supplementing the feed with bypass protein or starch.
To be able to use lactating or breeding cows for work in developing countries where they are fed mainly crop residues it will be essential to:
Maximise the efficiency of rumen function
Understand the factors limiting intake in working animals so that these can be manipulated
Provide supplements to correct imbalances in nutrients so as to support both ``production" and work.
The first component of this strategy is fairly well understood. The second and third components require more research. Clarifying the effects of work and/or dietary supplements on the feed intake of animals is an important first step, but this has not so far been researched. Providing the specific nutrients needed for both production and work probably has the highest priority. Production requires amino acids, LCFAs and glucogenic precursors, whereas work apparently increases the animal's requirements for LCFAs and glucose. Oilseed cakes and leguminous forages are advocated (see Chapter 7 and Chapter 8) as the most appropriate sources of bypass protein and LCFAs. Increasing the availability of glucose to the animal is the most difficult and least researched area. Broken grains from rice and maize may fulfill this role, as they apparently supply bypass starch (see Chapter 7). The other approach is to alter the rumen ecosystem to increase microbial growth (as a source of gluconeogenic amino acids) and to increase the production of propionate relative to the other VFAs. Bypass protein will also increase the gluconeogenic potential of the diet.
It may not be merely chance that the kinds of supplement required for this purpose (eg. mixtures of rice bran, broken rice and oilseed meals) are those frequently used by smallholders in developing countries.
For the purposes of simplification, tissue growth is regarded largely as fat and protein synthesis. The substrates that are needed include amino acids for protein deposition and acetate, butyrate and dietary LCFAs for fat synthesis. There is a heavy demand for NADPH in fat synthesis (a major proportion of which arises from glucose oxidation in the phosphogluconate pathway) and for glycerol for triglyceride synthesis. There is also a smaller demand for glucose to provide such compounds as ribose (nucleic acids) and carbohydrate moieties for the synthesis of a range of cell constituents (eg. galactolipids).
For illustrative purposes, the ratios of nutrients needed for growth are calculated (Table 4.7) from composition data of animals at various liveweights (see Table 4.13). These data (Table 4.7) show that, assuming acetate is the precursor for adipose tissue growth, the glucogenic energy to protein ratio is markedly imbalanced and there is a chronic deficit of glucose relative to protein. The only explanation that appears feasible is that the fat in body tissues arises mainly from dietary sources, which is in agreement with the conclusions of Lindsay (1983) and Thornton and Tume (1984).
|
Table 4.7: The balance of glucogenic energy to protein and fat-energy in tissue growth (as dry matter) of cattle over the range 30 kg (birth) to 500 kg (maturity) body weight. |
|||||||
|
Body weight |
Tissue composition |
Glucose oxidised for fat synthesis |
Ratio of glucogenic energy to protein |
Ratio of protein to fat energy |
Ratio of glucose to LCFA energy |
||
|
Protein |
Fat |
||||||
|
(kg) |
(g) |
(g) |
(MJ) |
(MJ) |
(kJ/g) |
(g/MJ) |
(%) |
|
30 |
82 |
18 |
0.68 |
0.30 |
4(1) |
120 |
54 |
|
100 |
65 |
35 |
1.3 |
0.58 |
9(2) |
50 |
55 |
|
200 |
48 |
52 |
2.0 |
0.86 |
18(4) |
24 |
53 |
|
300 |
35 |
65 |
2.5 |
1.10 |
31(7) |
14 |
54 |
|
400 |
27 |
73 |
2.8 |
1.20 |
44(10) |
10 |
53 |
|
500 |
21 |
79 |
3.0 |
1.30 |
62(14) |
7 |
53 |
|
Assumptions: 1. 0.89 g glucose required/g fat synthesised from acetate. 2. Values in brackets are calculated assuming that the fat is synthesised from dietary long-chain fatty acids. |
|||||||
Although the protein-to-energy ratio in deposited tissues is imbalanced relative to the products of fermentation in the rumen, it is adjusted at the tissue level by the higher requirement for energy relative to protein for maintenance or, in the working animal, by the higher metabolic rate due to work.
The pattern of growth of the placenta and the foetus imposes a variable nutrient demand during pregnancy. Growth of the placenta follows the pattern shown in Figure 4.15 and the growth of the foetus only commences, at a high rate, when placental growth is complete. The modifying effects of the placenta on foetal growth are not well understood but placental size and size of the foetus are highly correlated (Mellor 1983).
 |
| Figure 4.15 The placenta growth occurs over the first two thirds of pregnancy and the majority of foetal growth occurs in the last trimester. Therefore the demand for essential nutrients is much greater in the last third of pregnancy. |
The uptake of nutrients by the gravid-uterus increases with advancing pregnancy and it utilises glucose and amino-N throughout gestation (Reynolds et al. 1986). The utero placenta uses a substantial proportion of the substrates taken up by the gravid uterus. The uptake of glucose by the utero placenta is increased threefold from mid to late pregnancy (Bell 1984), however, the large demand for this critical nutrient is ameliorated to some extent since approximately 30% of the glucose taken up is returned to the maternal and foetal circulations as lactate (Reynolds et al.. 1986), which can be recycled to glucose. Glucose and lactate, if completely oxidised could account for 63% of foetal energy requirements, indicating that other substrates (probably amino acids and acetate) are also utilised to meet the energy demands of pregnancy (Reynolds et al. 1986).
Foetal growth makes a large demand on glucose and amino acids over the last third of the pregnancy. These are the nutrients likely to be in critical supply when fibrous diets low in N and/or bypass protein are fed. Recent results have indicated that foetal size is particularly effected by ammonia deficiency in the rumen of sheep and cattle on dry pastures (see Chapter 7).
Amino acids are required for milk-protein synthesis and glucose is needed for synthesis of milk lactose and glycerol of triglycerides and for oxidation to provide co-factors (NADPH). The demand for these nutrients is an enormous constraint in animals that rely on rumen fermentation per se for their nutrients. The need for extra glucose during lactation can be inferred from the almost three-fold increase in glucose entry rate (synthesis rate) in lactating cows as compared with dry cows (see Herbein et al. 1978); and that 60 to 85% of the glucose synthesised is apparently taken up by the mammary gland (Annison and Linzell 1964).
For individual species the amount of lactose and protein in the milk is relatively constant, whereas milk fat is often variable and is higher with lower milk yield. The solids in milk are essentially fat, protein and lactose. Table 4.8 gives the composition of the milk of various ruminant species.
|
Table 4.8: The approximate composition of 1 kg of mill..~ from a number of ruminant species. The ratios of glucogenic energy to total energy (G/E) and to protein (G IP) are calculated as indicated. Milk fat is assumed to be tripalmitin and to be synthesised 50:50 from acetate and LCFAs of dietary origin (A). The values are affected if 50% of the NADPH for LCFA synthesis arises from the isocitric dehydrogenase reaction (B). |
||||||
|
Milk composition |
|
Western cow |
Zebu cow |
Buffalo |
Goat |
Sheep |
|
Protein (g) |
|
34 |
32 |
40 |
29 |
55 |
|
Fat (g) |
|
37 |
50 |
75 |
45 |
74 |
|
Fat (MJ) |
|
1.4 |
1.9 |
2.9 |
1.8 |
2.9 |
|
Lactose (MJ) |
|
0.84 |
0.61 |
0.84 |
0.72 |
0.84 |
|
Glucose-derived energy (MJ) |
0.98 |
0.80 |
1.10 |
0.90 |
1.10 |
|
|
Energy content (fat + lactose) (MJ) |
2.24 |
2.51 |
3.74 |
2.52 |
3.74 |
|
|
Glucose oxidised for fat synthesis (MJ)l |
|
|
|
|
|
|
|
A. |
|
0.22 |
0.29 |
0.44 |
0.26 |
0.44 |
|
B. |
|
0.11 |
0.15 |
0.22 |
0.13 |
0.22 |
|
Total glucose used (MJ)2 |
|
|
|
|
|
|
|
A. |
|
1.20 |
1.09 |
1.54 |
1.16 |
1.54 |
|
B. |
|
1.09 |
0.95 |
1.32 |
1.03 |
1.32 |
|
G:P ratio (kJjg) |
|
|
|
|
|
|
|
A. |
|
35 |
34 |
38 |
41 |
28 |
|
B. |
|
32 |
30 |
33 |
35 |
24 |
|
G:E ratio (%) |
|
|
|
|
|
|
|
A. |
|
54 |
43 |
41 |
46 |
41 |
|
B. |
|
49 |
38 |
3.5 |
41 |
35 |
|
P:E ratio (g/MJ) |
|
15 |
13 |
11 |
12 |
15 |
|
Assumptions:
|
||||||
Calculations of the amounts of glucose and glucose precursors (glucogenic energy) needed for milk fat synthesis (eg. glycerol and NADPH) and deposition of lactose are based on the following assumptions:
Lactose arises from plasma glucose and 1 mole of lactose is synthesised from 2 moles of glucose
Milk fat arises mainly from acetate or LCFAs and acetate
Glucose oxidation provides the reduced co-factors for converting acetate to LCFAs
Fat is present as tripalmitin and glycerol is synthesised from glucose.
The data in Table 4.9 are derived from Table 4.1 and illustrate the relationship between the balance of nutrients available from rumen fermentation under different microbial growth efficiencies and two patterns of VFA production. The data in Table 4.10 summarise the nutrient balances in milk for different species.
|
Table 4.9: Comparison of the ratios of nutrients from rumen fermentation at different microbial growth efficiencies assuming two patterns of VFA production. |
||||||
|
|
P/E ratio |
G/P ratio |
G/E ratio |
|||
|
YATP |
LP |
HP |
LP |
HP |
LP |
HP |
|
8 |
12 |
12 |
22 |
34 |
27 |
38 |
|
14 |
23 |
22 |
11 |
18 |
27 |
38 |
|
19 |
34 |
32 |
8 |
12 |
27 |
38 |
|
25 |
47 |
45 |
6 |
8 |
27 |
38 |
|
LP = 70% acetic acid, 30% propionic acid and 10% butyric acid. H P = 60:30:10. P/E = the ratio of microbial protein to VFA energy. G/P = the ratio of glucogenic energy (propionate) to microbial protein. G /E = the glucogenic energy to total VFA energy. |
||||||
|
Table 4.10: Comparison of the nutrient ratios needed for milk synthesis in different ruminant species. Milk fat is synthesised in equal proportions from. both VFAs and long chain fatty acids. The relative proportions from. each source are dependent on diet and to obtain the maximum range of the ratios, these have been calculated assuming: (i) that half the fatty acids are synthesised from acetate and that 0.89 g of glucose is required per g of fat synthesised (A) or (ii) that half the NADPH arises from. acetate oxidation. (B) and (iii) that the fat in milk can be considered to be palmitic acid. The range of values therefore indicates the maximum and minimum ratios |
|||||
|
|
|
G/P ratio |
G/E ratio |
||
|
|
g/MJ |
A |
B |
A |
B |
|
Friesian |
15 |
35 |
32 |
54 |
49 |
|
Zebu |
13 |
34 |
30 |
43 |
38 |
|
Buffalo |
11 |
38 |
33 |
41 |
35 |
|
Goat |
12 |
41 |
35 |
46 |
41 |
|
Sheep |
15 |
28 |
24 |
41 |
35 |
A comparison of the data in these two tables indicates that the end-products of rumen fermentative digestion are always balanced for milk production in terms of the supply of microbial protein relative to total energy as VFAs. In contrast, the ratio of glucogenic energy to microbial protein is always imbalanced for milk production in all ruminant species. Similarly, the ratio of glucogenic energy to total VFA energy is generally lower than is required for milk synthesis.
As the efficiency of microbial growth increases, the balances of glucogenic energy to microbial protein become less favourable in relation to the needs for milk synthesis. These ratios are calculated on the assumption that all the microbial protein is available. Hagemeister et al. (1980) showed that the digestibility of microbial protein in lactating cows was 95%; however, the usually accepted value is 75 to 80%.
Calculating estimates of the glucogenic-energy-to-protein ratio using a digestibility of microbial protein of 75% gives a closer balancing of glucogenic energy to protein . Another important consequence of the imbalanced ratios is that the lower the propionate production relative to the other VFAs, the greater the need to use amino acids in gluconeogenesis.
The dietary constraints to milk synthesis (ie. the need for glucogenic energy) are alleviated when dietary LCFAs are absorbed (Figure 4.16). Where a proportion of the milk fat arises from these sources considerably less glucogenic energy (to supply NADPH) is required by the mammary gland. Where LCFAs are available from plasma the balance of products of fermentative digestion matches the ratios of nutrients required in milk production, particularly when the fermentation provides 30% of the VFAs as propionate.
 |
| Figure 4.16 Balance sheet of metabolic activity of the goat's udder during the secretion of 100 ml milk. The output of the major constituents is compared with the uptake of minor components and the small degree of overlap between the major ones. The number of calories oxidised is calculated from the O2 uptake, and the proportion of glucose and acetate oxidised is calculated from 14CO2 production in isotope dilution experiments. BOH but = B-hydroxybutyrate. (Source: Linzell 1968). |
|
Table 4.11: The ratio of the carbon in milk arising from short-chain fatty acids produced in the rumen relative to that arising from. dietary long-chain fatty acids. |
|||
|
Carbon in milk potentially derived from |
|||
|
Species |
Rumen
VFA |
Dietary
long-chain
fatty
acids,
mM/kg |
Ratio
|
|
Cow |
2635 |
2694 |
1.0 |
|
Buffalo |
2899 |
2502 |
0.9 |
|
Sheep |
3760 |
1843 |
0.5 |
|
Goat |
3465 |
2698 |
0.8 |
|
Assumptions: that half the C16 and all the C4 to C14 fatty acids arise from acetate and butyrate. The balances of C16 plusC18 fatty acids are derived from dietary long-chain fatty acids. |
|||
In reality, fat in milk probably arises from both sources (Table 4.11). Ruminant milk fats are characterised by the presence of substantial quantities of short- to medium-chain fatty acids which are probably synthesised from acetate and ketone bodies (Popjak et al. 1951). The longer-chain fatty acids appear to arise mainly from the constituent fatty acids of plasma lipids but approximately half the palmitic acid arises from short-chain precursors (Bines and Brown 1968; Palmquist et al. 1969). The probable source of substrates for milk synthesis is shown in Figure 4.16. The source of the fatty acids will however vary according to the nature of the diet.
The composition of milk fat in various ruminant species is shown in Table 4.12. If it is assumed that the C4 to C14 fatty acids plus half the C16 fatty acids are synthesised from acetate and butyrate, then more than 50% of the milk fat is derived from LCFAs extracted from blood by the mammary gland in the cow and buffalo. The ewe appears to be more dependent on short-chain precursors for fat synthesis and the goat is intermediate (Table 4.12).
|
Table 4.12: The composition of fatty acids of milk fat A (g/kg) and B (mM of carbon/kg) from different ruminant species |
||||||||||||
|
|
|
|
Fatty acids |
|
|
|||||||
|
|
Species |
Milk fat |
C4 |
C6 |
Cs |
C1O |
C12 |
C14 |
C16 |
C18 |
Reference |
|
|
|
Cow |
A |
33 |
16 |
13 |
30 |
13 |
95 |
263 |
434 |
Rook and Thomas (1983) |
|
|
|
|
B |
688 |
222 |
135 |
250 |
90 |
562 |
1370 |
2009 |
|
|
|
|
Buffalo |
A |
39 |
16 |
8 |
16 |
21 |
108 |
330 |
355 |
Kay (1974) |
|
|
|
|
B |
8 |
222 |
83 |
133 |
146 |
643 |
1718 |
1643 |
|
|
|
|
Sheep |
A |
33 |
38 |
56 |
66 |
13 |
130 |
210 |
145 |
Rook and Thomas (1983) |
|
|
|
|
B |
688 |
528 |
583 |
550 |
90 |
774 |
1094 |
1290 |
|
|
|
|
Goat |
A |
26 |
29 |
27 |
84 |
33 |
103 |
268 |
454 |
Glass et aI. (1967) |
|
|
|
|
B |
542 |
403 |
280 |
700 |
229 |
613 |
1396 |
2000 |
|
|
In sheep only 5 to 18% of the circulating LCFAs were synthesised in the liver (Ingle et al. 1972; Prior 1978) and up to 30% arise from synthesis in the wall of the gastro-intestinal tract (Ingle et al. 1972). The extra-hepatic tissues might synthesise some LCFAs but the majority of the circulating fatty acids are of dietary origin (see Lindsay 1983). This means that most milk fat is synthesised from dietary fat.
In calculating the various balances of nutrients required according to the productive state of the animal, no account is taken of maintenance needs. The reasons are two-fold: (i) basal metabolism almost certainly increases with rate of productivity and probably for different functions (milk vs growth vs work) (Armstrong and Blaxter 1984), and (ii) when the basal diets are crop residues and byproducts they are fed ad libitum and feed intake is a function of the degree to which the nutrients are balanced (P/E, G/E and G/P).
The needs for protein and glucogenic energy relative to VFA energy for maintenance are likely to be less than for milk or tissue synthesis. Therefore, the higher the rate of productivity, the greater the problems in balancing nutrients. In this respect it must be emphasised that, in quantitative terms, milk synthesis is very much more demanding than growth (Table 4.13).
|
Table 4.13: Amount of materials secreted in milk relative to liveweight gain. The drain on nutrients is much greater even at moderate rates of milk production relative to liveweight gain. The values for fat and protein in growth are for finishing cattle (Byers 1977). |
|||||||
|
|
Milk synthesis |
|
|
Growth |
|
||
|
Milk yield (kg/d) |
Fat
|
Protein |
Lactose |
|
Growth rate |
Fat in growth |
Protein in growth (g/d) |
|
5 |
200 |
165 |
200 |
|
250 |
50 |
40 |
|
10 |
400 |
330 |
400 |
|
500 |
160 |
80 |
|
15 |
600 |
495 |
600 |
|
750 |
300 |
100 |
|
20 |
800 |
660 |
800 |
|
1000 |
480 |
120 |
When animals mobilise body fat or absorb LCFAs for milk-fat synthesis the need for glucose is reduced. Low-fat diets which are generally associated with low-propionate fermentations in the rumen are likely to result in very inefficient use of metabolisable energy for milk production. This situation is exacerbated in animals of high genetic potential, in which excessive weight loss occurs on such diets early in lactation and the lactation yield is dramatically reduced (see Figure 4.17).
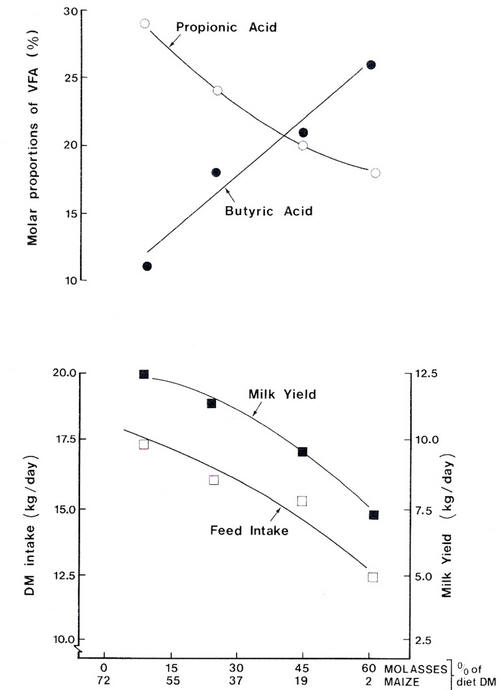 |
| Figure 4.17 Effect of replacing maize with molasses on the pattern of rumen fermentation and milk yield in Holstein cows. As dietary molasses increased, the proportion of propionic acid in rumen fluid VFA decreased and there was a concomitant fall in milk yield (Source: Clarke et al. 1972). |
When ruminants are on diets that give a high-acetate fermentation, glucose must be provided to supply glycerol and also for oxidation to synthesise body and milk fat. Supplementation with bypass protein stimulates milk production and increases the need for glucose. This in turn increases the imbalances between these critical nutrients and the animal responds by using amino acids for gluconeogenesis or by mobilising additional fat.
Where bypass starch is provided the animal does not need to mobilise fat, because enough glucose is available to provide the oxidative energy and the extra lactose needed. Animals fed diets that contain bypass starch tend to maintain or increase milk yield slightly and tend to partition nutrients towards tissue deposition. Supplementation with balanced bypass protein and glucose should increase both bodyweight gain and milk production, particularly if some fat is provided by the supplement (eg. in the case of oilseed meals).
These effects may not be seen in ruminants fed a high-concentrate diet which supports a relatively low efficiency of microbial growth in the rumen (see Hagemeister et al. 1980) and increases propionate production. Such diets also contain appreciable amounts of lipids (eg. from maize and oilseed meals). The effects on milk production and body weight change of feeding either a bypass starch or a bypass-protein supplement to grazing cows (high-acetate fermentation) supports this hypothesis (Table 4.14).
|
Table 4.14: The effect of bypass protein (and bypass starch) on liveweight change and milk production of olstein cows grazing Japanese millet |
|||
|
|
Soluble starch/ protein1 |
Bypass |
|
|
|
Protein2 |
Starch3 |
|
|
Milk yield (kg/d) |
16.7 |
18.1 |
17.9 |
|
Milk fat (%) |
3.9 |
3.9 |
4.0 |
|
LWt change (g/d) |
-120 |
+80 |
+250 |
|
Source:
Throckmorton
and Leng
(1984).
|
|||
Absorption of glucose tends to inhibit gluconeogenesis and therefore the absorption of small amounts of glucose could be detrimental unless there is an overall increase in glucose availability. Animals may take some time to adapt to absorbing glucose from the digestive tract (J C Throckmorton and R A Leng, unpublished observations).
The analysis of the relationship between the glucogenic energy/protein and the percentage glucogenic energy in the total VFAs produced has highlighted:
The need for dietary fat to spare glucose from oxidation
The availability of glucose.
Does this have any practical significance in ruminant nutrition? The critical nature of glucose availability for growth and milk production will be manifested on diets which are low in starch and fat and where propionate production is low. This represents the dietary profile of the majority of ruminants in the tropics.
The need to manipulate or supplement diets in order to ensure adequate amounts of glucose and/or glucogenic compounds for efficient production was proposed by Leng and Preston (1976). As this thesis is disputed (see ARC 1980) it is necessary to present the evidence that justifies the need to take account of the glucogenic potential of a diet (see Annison and Armstrong 1970).
In cattle fattening systems, molasses-based diets supplemented with bypass protein supported levels of growth comparable to those from grain-based diets (Preston et al. 1967). Molasses-fed animals have a poorer feed efficiency and lower carcass fat content (Redferne and Creek 1972). However, it was impossible to support even moderate levels of milk production on a molasses-based diet (Figure 4.17). Milk yield was closely related to the proportion of propionate relative to other VFAs in the rumen in animals fed molasses (a very low fat diet).
Rice polishings with a large proportion of broken rice grains and oil (12%) were found to be a better supplement than cassava-root meal for growing cattle fed sugarcane-based diets (Preston et al. 1976; Silvestre et al. 1977). Glucose entry rates were higher in cattle fed sugarcane-based diets when rice polishings rather than cassava-root meal was the supplement (Ravelo et al. 1978). The starch in rice polishings escaped rumen fermentation almost entirely (Elliott et al. 1978a) whereas the starch of cassava-root meal was fermented rapidly in the rumen (Santana and Hovell 1979a). Rice polishings also provided a considerable amount of fat and bypass protein.
Supplementary maize grain (which has good rumen-escape characteristics and a relatively high oil content) improved feed conversion efficiency in cattle fed sugarcane pith, whereas the same amount of molasses energy (which is completely fermented in the rumen and contains no fat) reduced feed conversion efficiency (Donefer, cited by Pigden 1972).
Corbett et al. (1966), in a calorimetric study, demonstrated that in Scotland the herbage grown in the spring was more efficiently used for fat synthesis by sheep than that grown in autumn (Figure 4.18). For this discussion, the important difference was the higher proportion of propionate in the rumen VFAs of the sheep given the herbage grown in spring.
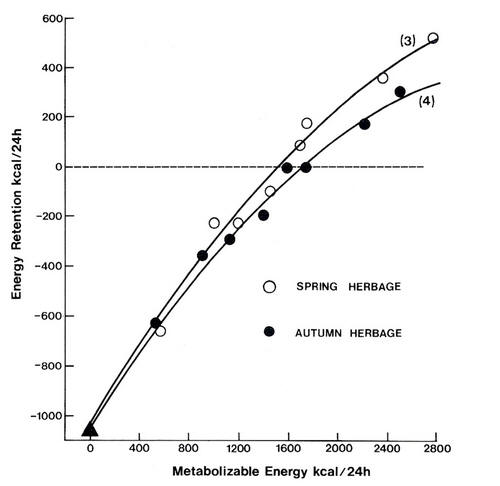 |
| Figure 4.18 Relationship between metabolisable energy intake and energy retention in sheep fed spring or autumn pasture respectively. Rumen VFAs were: acetic 66 and 72; propionic 24 and 17; and butyric 7 and 8 for spring and autumn pasture respectively (Source: Corbett et al. 1966). |
More recently, it has been demonstrated that infusing casein (30g/day) into the abomasum of sheep given artificially dried autumn-grown grass increased the efficiency of utilisation (kf) of the energy in the herbage from 0.45 to 0.57 (MacRae et al. 1985). The authors suggested that this was a result of extra glucogenic amino acids being absorbed from the small intestine.
Thomson (1978) found that the efficiency with which metabolisable energy was used for tissue synthesis in sheep was higher for concentrate/forage combinations of maize and clover than for barley and rye grass even though the metabolisability of the feed dry matter (ME/DM) was the same for all diets. One explanation is that less of the dry matter of the maize/clover diet was fermented in the rumen than of the barley/grass diet (Table 4.15). Also maize contains twice as much oil as barley.
|
Table 4.15: Efficiency of utilisation of metabolisable energy for fattening cattle (kf) according to the nature of the ingr'edients in the diet. Ration combinations containing maize grain and clover forage were used more efficiently than those containing barley grain or ryegrass forage. |
|
|
Forage/grain1 |
Efficiency (kf=%) |
|
Ryegrass + barley |
36 |
|
Ryegrass + maize |
42 |
|
Clover + barley |
44 |
|
Clover + maize |
50 |
|
Source:
Thomson
(1978).
|
|
Research in Australia showed that pangola grass was used more efficiently than setaria grass for tissue synthesis in young, growing cattle, even though both had the same apparent digestibility and were fed at the same rate (Table 4.16). The authors noted a higher concentration of propionate in rumen fluid of sheep fed pangola grass as a possible explanation for the difference. It is also feasible that microbial growth efficiencies were higher on the pangola-grass diets.
|
Table 4.16: The metabolisable energy in pangola grass was used more efficiently by growing cattle than was the energy in Setaria grass. Both grasses had the same concentration of metabolisable energy in the dry matter |
||
|
|
ME (MJ/kg DM) |
kf (%) |
|
Setaria |
8.0 |
17 |
|
Pangola |
8.1 |
28 |
|
Tudor and Minson 1982 |
||
In experiments in North America, increasing the cereal-grain content of a dairy-cow diet increased the ratio of propionate to acetate/butyrate and increased the partial efficiency of milk production (Figure 4.19).
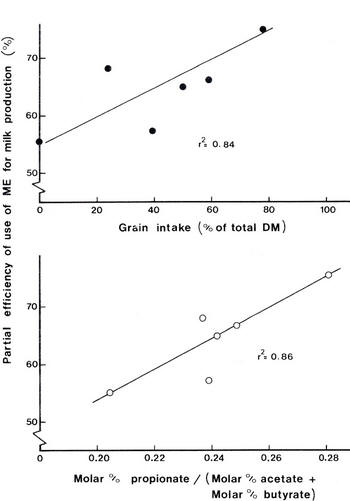 |
| Figure 4.19 Effect of the grain content of the diet of lactating cattle on the molar ratios of propionate to acetate plus butyrate in rumen fluid and on the partial efficiency of use of metabolisable energy (ME) for milk production (Source: Elliot et al. 1965). |
Studies from New Zealand show that the metabolisable energy of a clover/rye grass mixture was much less efficiently used than a grain/fishmeal mixture for growth of lambs. The clover/pasture ration supported half the growth rate that was supported by an equal intake of metabolisable energy as grain/fishmeal (see Table 12.2).
Leng et al. (1978) (see Table 4.17) examined the interaction between dietary bypass protein (fishmeal) and glucose infused into the abomasum in lambs fed a basal diet of sugar/oaten chaff supplemented with urea and minerals. Feed intake and growth rates were increased by bypass protein. Glucose had no effect on feed intake but increased liveweight gain and feed-conversion efficiency.
|
Table 4.17: The effects of bypass protein (fish meal in diet) and glucogenic energy (glucose infused into the abomasum) on feed intake, growth rate and feed conversion in lambs fed a basal diet of sugar/oaten chaff (rumen fermentable carbohydrate). |
||||
| Fish meal (% in diet) | 0 | 6 | 0 | 6 |
| Glucose infused (g/d) | 0 | 0 | 80 | 80 |
|
Feed intake (g/d) |
890 |
1140 |
770 |
1070 |
|
Live'weight gain (g/d) |
100 |
200 |
130 |
260 |
|
Feed conversion (g/g) |
8.9 |
5.7 |
5.9 |
4.1 |
|
Source: Leng et al. (1978). |
||||
Additional supporting evidence is provided by Orskov(1979), who found that sheep nourished by infusion of VFAs into the rumen and by infusion of casein into the abomasum increased their nitrogen retention as the proportion of propionic acid in the infused VFAs was increased (see Figure 4.20).
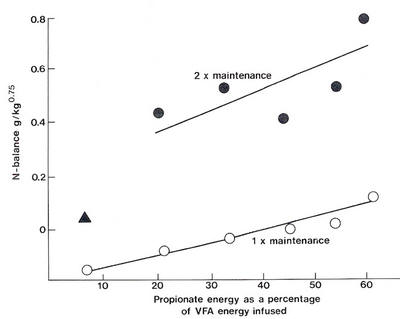 |
| Figure 4.20 Relationship between proportion of glucogenic energy in the mixture of VFAs infused into the rumen of sheep and N retention. The `diet' comprised only VFA infused into the rumen and casein infused into the abomasum at maintenance and twice maintenance levels of feeding. (Adapted from Orskov et al. 1979). |
Forage/grain1 Efficiency (kf = %) Ryegrass + barley 36 Ryegrass + maize 42 Clover + barley 44 Clover + maize 50 Source: Thomson (1978). 1. Content of metabolisable energy in diet dry matter was similar for all ration combinations.
Grass species ME (MJ/kg DM) kf (%) Setaria 8.0 17 Pangola 8.1 28 Source: Tudor and Minson (1982).
In the studies of Blaxter and his colleagues (see Blaxter 1962), there was apparently a positive linear relationship between the molar proportions of propionate in the rumen VFAs and the efficiency with which metabolisable energy was used for fattening (see Figure 4.21). As the animals were mature they were laying down mostly fat.
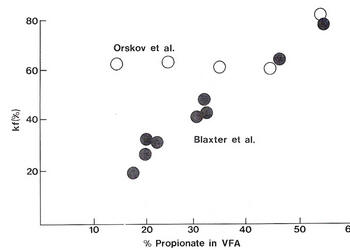 |
| Figure 4.21 The relationship between the molar proportion of propionic acid in the rumen VFAs and the efficiency with which metabolisable energy consumed above maintenance is used for tissue synthesis. |
It is relevant to compare Blaxter's data with the results obtained by Orskov et al. (1979) with young lambs nourished by infusion of VFAs into the rumen and casein into the abomasum (Figure 4.20). The data clearly show that deposition of proteinaceous tissue was increased in young animals as the proportion of glucogenic energy increased.
There is obviously less need for glucogenic energy when the body tissues synthesised contain more protein than fat. The highly efficient use of both dietary energy and protein at the highest level of glucogenic energy (ie. where the data of Blaxter and Orskov and their colleagues coincide) is clearly the optimum balance of nutrients (ie. a G/E ratio of 53% and a G/P ratio of 54 kJ/g). The optimum balance of these nutrients would be highly dependent on the P/E ratio, which was 10 for the infusions into young lambs (Orskov et al. 1979). A P/E ratio of 10 (assuming casein is 100% digestible) would represent an efficiency of microbial growth in the rumen equivalent to a YATP of 7, which is relatively low (see Figure 3.11). From the data in Figure 4.21 it seems that at all but the highest propionate levels in the VFA infused, the infused nutrients are being used less efficiently than is possible. Therefore more heat is being generated by the sheep at the lower propionate concentrations in the VFA infused.
The need for glucogenic compounds in the end-products of digestion was convincingly shown by Tyrrell et al. (1979) (Figure 4.22). Acetic acid infused into the rumen of animals receiving a basal diet of low glucogenic potential (alfalfa hay) was used less efficiently for tissue synthesis than when the infusion of acetate was given in a basal diet with a high potential for providing glucose (60% maize grain, 40% hay).
|
|
| Figure 4.22 Effect of the basal diet on the efficiency of utilisation of acetic acid infused into the rumen of cattle. The efficiency of utilisation was higher when the basal diet was rich in glucose precursors (ie. with 75% concentrates). (Adapted from Tyrrell et al. 1979). |
The superior nutritive value of propionic acid compared with that of acetic acid observed in the original work of Armstrong and Blaxter (1957a, b) and Armstrong et al. (1958) and the absence of differences between these two fatty acids in the experiments of Orskov and Allen (1966) can also be explained in terms of the glucogenic potential of the basal diet. The diet used by Armstrong et al. (1958) was dried grass (low glucogenic potential) whereas Orskov and Allen (1966) gave the different VFA mixtures to animals fed mainly on barley grain (high glucogenic potential).
Early studies in Australia that examined the role of glucose as a priming substrate for the TCA cycle (ie. providing oxaloacetate) used acetate clearance rate as a measure of glucose sufficiency (Table 4.18). The data show that, almost always, acetate clearance was most rapid on those diets likely to have high glucogenic potential (ie. diets high in protein or maize; or where it could be expected that large proportion of the rumen VFAs would be propionate).
|
Table 4.18: Acetate tolerance teats with sheep on diets of high or low glucogenic potential . |
||||
|
|
Glucose potential |
T1/2 (min) |
||
|
Ration (g/d) |
|
|
|
|
|
600 Lucerne ha . |
** |
21 |
||
|
1200 Lucerne hay |
**** |
15 |
||
|
600 (Lucerne 40%; |
|
|
|
|
|
maize 50%; |
|
|
|
|
|
peanut meal 10%) |
*** |
21 |
||
|
1200 |
" |
**** |
13 |
|
|
520 Wheat straw /hay |
* |
29 |
||
|
360 Maize germ; |
|
|
|
|
|
900 maize grain |
***** |
9 |
||
|
350 Lucerne/maize grain |
**** |
19 |
||
|
700 '''heat/lucerne hay |
|
21 |
||
|
300 Wheat hay; |
|
|
|
|
|
300 wheat straw |
* |
26 |
||
|
800 Wheat hay |
** |
21 |
||
|
800 Lucerne hay |
**** |
7 |
||
|
Ad lib green pasture |
**** |
9 |
||
|
Ad lib dry pasture |
* |
20 |
||
|
510 Oat hay |
|
|
|
|
|
Low-N |
** |
25 |
||
|
High-N |
**** |
4 |
||
|
Source: Weston (1966); Reid (1958); Jarrett an Filsell (1960); Egan (1965). |
||||
The rate of clearance of injected acetate on the lucerne hay diet was highly correlated (r2 = 0.98) with feed intake (Figure 4.23). The increasing level of intake could be expected to lead to greater bypass of potential glucogenic nutrients to the lower digestive tract.
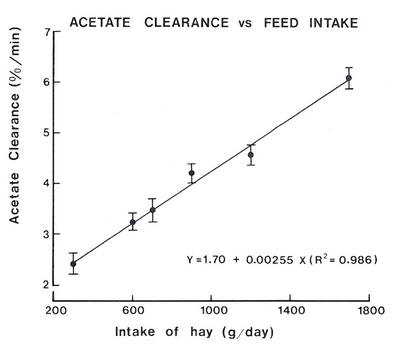 |
| Figure 4.23 Relationship between intake of lucerne hay by sheep and the rate of clearance of injected acetate (% per minute) from blood (Adapted from Weston 1966). |
This work indicates that there is a close correlation between the ability of an animal to clear acetate and the availability of glucose. Ruminants must control blood acetate within physiological limits, and therefore feed intake and fermentation rate must match the animal's ability to utilise acetate, which is dependent on the availability of glucose provided that the acetate is being used for fat synthesis. This hypothesis should be tested, since acetate clearance rate is relatively easy to measure.
The other point arising from these considerations is that the intake of a particular feed will be maximised when availability of nutrients matches the animal's nutrient requirements. Therefore, the ability of the animal to clear acetate could be used as an index of the ``balance" of the absorbed nutrients. This relationship could be especially useful in studying the effects of supplements in studies with grazing animals.
In recent work (P. Cronje, J.V. Nolan and R.A. Leng; Figure 4.24), it was found that in sheep fed a straw-based diet supplemented with three levels of bypass protein, the rate of acetate clearance had a similar relationship with feed intake as that reported by Weston (1966). However, when sodium propionate was included in the diet, the rate of acetate clearance increased markedly with the amount of propionate added. Thus acetate clearance was improved to only a small extent by increased amino acid supply (which also stimulated feed intake), whereas the amount of propionate in the diet increased acetate clearance rate substantially and linearly (Figure 4.24).
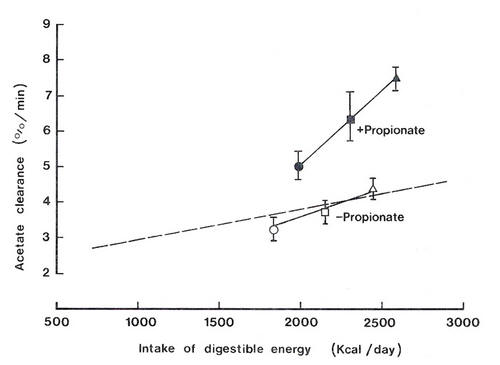 |
| Figure 4.24 Rate of acetate clearance in sheep fed ammoniated wheat straw and minerals increased with feed intake when this was stimulated by bypass protein. Addition of propionate to the diet stimulated acetate clearance rate at all levels of protein supplementation indicating a large dependency of acetate clearance on glucogenic potential of the diet (Source: P Cronje, 1988). The relationship established by Weston (1966) is shown as a dotted line. |
In a second experiment by the same authors, sheep given the same chopped wheat straw diet were also given a fixed amount of sodium acetate (0.42 moles/day) in their diet with various levels of sodium propionate rising from 0 to .62 moles per day. The rates of clearance of an acetate load with the various combinations of acetate and propionate supplements are shown in Figure 4.25 and indicate a greater ability to clear acetate with increasing levels of propionate in the diet.
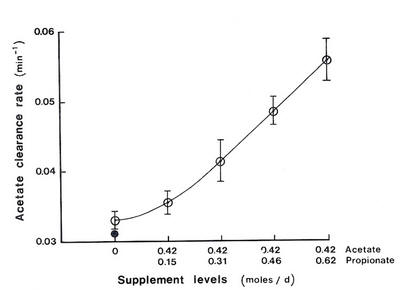 |
| Figure 4.25 The rate of acetate clearance was stimulated when increasing levels of propionate were added to a basal diet of ammoniated straw supplemented with a fixed level of acetate (Source: P Cronje 1988). |
These two experiments illustrate that supplementation with a bypass protein has a relatively small effect on the ability of sheep to dispose of an acetate load. Increasing the availability of propionate, however, has an effect on acetate utilisation which is many fold that of amino acids. The different effects are probably a reflection of the amount of ``free glucose" that is potentially or actually available from a mixture of amino acids relative to propionate. Only 55 g of glucose can be synthesised from the amino acids in 100 g protein, leaving approximately 45 g of acetogenic amino acids. On the basis that 1 g of fat requires 0.65 g of glucose to be oxidised, it is obvious that there is a smaller availability of glucose, when the acetate, (also produced from amino acids) has been cleared into fat. Roughly 15 g glucose would be needed to dispose of the acetogenic compounds arising from catabolism of 100 g protein. The free glucose is therefore 40 g/100 g protein catabolised.
It is unlikely that more than 60% of the protein fed to sheep in the studies shown in Figure 4.24 and Figure 4.25 bypassed the rumen and therefore the potentially free glucose is likely to be about 24 g/100 g protein fed.
On the basis of the data in Figure 4.24, acetate clearance, when the glucogenic potential of the diet is not limiting (ie. when propionate was supplemented) was improved by amino acid availability. This could be explained by increased acetate oxidation to provide ATP for protein synthesis and suggests that acetate clearance is not only an indication of the glucogenic potential of a diet but also of the amino acid availability and may therefore be useful in indicating diet quality in terms of the balance of nutrients supplied.
Acetate clearance appears to reflect the capacity of an animal to utilise acetate and could be an index of the animal's glucogenic substrate status. The influence of additional protein on acetate clearance in sheep fed a low protein diet followed a pattern established by Weston (1966), however, addition of highly glucogenic substrate (propionate) had a massive effect on acetate clearance.
Kronfeld (1982), in his discussion of the metabolic determinants of milk production in the relatively high yielding dairy cow, highlighted that:
Rate of milk synthesis is a function of uptake of glucose by the mammary gland, and
The efficiency of milk synthesis is a function of uptake of LCFAs by the mammary gland.
The evidence presented for these statements is that:
Enzyme activities in the mammary gland are not rate limiting (Hartmann 1969)
Milk secretion in the perfused udder of goats varied directly with the perfusate concentration of glucose but not with the concentrations of amino acids or acetate (Hardwick et al. 1961; Linzell 1967)
In ketotic cows, milk yield responded linearly to stepwise increments of infused glucose (Kronfeld 1970)
The amount of glucose passing through the blood pool in lactating cows was linearly related with milk production
The uptake of glucose by the mammary gland measured using blood flow rates and A-V differences (Hartmann and Kronfeld 1973; Kronfeld et al. 1968) was 72g/kg milk produced. A similar value was reported in goats by Annison and Linzell (1964).
Many physiological reactions seem to increase glucose oxidation and these could be extremely important in animals in which the availability and requirements for glucose are precariously balanced. For instance, Reid (1958) was able to induce a ketotic condition in pregnant sheep by subjecting them to the stress of road transportation. The sheep reacted by increasing corticosteroid secretion and becoming ketotic (ie. an inability to clear C2 energy).
The milk yield of ketotic cows was increased linearly by infusions of glucose (Kronfeld 1970), which also suggests that ketosis in high-yielding cows, in which glucose availability and requirements are precariously balanced, may be induced by any physiological reaction that partitions glucose use away from the mammary gland (eg. anxiety, fear, pain or increased muscle metabolism through exercise).
An interesting observation in Venezuela was that cows that were stressed by the early weaning of their calves lost more bodyweight and gave less milk than ``contented" cows that continued to have access to their calves in a restricted suckling system, despite having equivalent feed intake (see Chapter 11). This indicates that cows without calves used the available nutrients less efficiently.
In almost all temperate countries, cereal grains comprise at least 50% of the diets of intensively fed ruminants. Such rations give rise to relatively large quantities of propionic acid in rumen fermentation and considerable amounts of starch may escape from the rumen and be absorbed as glucose. Cereal grains contain more lipids than crop residues. Furthermore, most of the dietary nitrogen is in the form of true protein, and absorbed amino acids can reduce the amount of glucose that has to be oxidised. Thus the diets typical of temperate countries supply the animal with more glucogenic compounds than are likely to be needed. In contrast, tropical feed resources of high digestibility usually have low glucogenic potential since they frequently do not contain carbohydrates, which give rise to alimentary glucose, and result in VFA mixtures high in acetic and butyric acids rather than propionic acid (Table 3.5).
Increases in the nutritive value of feeds for ruminants in temperate countries are usually brought about by increasing the proportion of cereal grain and oilseed meal (with residual oil) in the diet. These changes increase both the digestibility of the diet and its glucogenic potential. In contrast, in most tropical countries, cereal grains and protein-rich meals are a scarce resource competed for by humans and monogastric domestic animals. The digestibility of diets in such situations can be improved by including sugar-rich byproducts (eg. molasses) or by treatment with alkali or acid to hydrolyse resistant ligno-cellulose.
Improvements in digestibility brought about by increasing the amount of sugar in the diet or by hydrolysing the cell walls in crop residues by alkali treatment do not lead to an increase in the glucogenic compounds in the end-products of digestion since neither strategy increases the likelihood of digestible carbohydrate escaping rumen fermentation. In addition, rumen fermentation of such modified feeds yields relatively small proportions of propionate, with large proportions of butyrate (for sugar-containing feeds) (Table 3.5) or acetate (for alkali- or acid-treated crop residues) (see Table 4.19 and Table 4.20).
|
Table 4.19: Effect of alkali (NaOH) treatment of barley straw on proportions of acetic (HAc), propionic (HProp) and butyric (HBut) acids in rumen fluid of cattle. |
|||
|
|
VFA, % |
||
|
|
HAc |
HPr |
HBut |
|
Untreated |
70 |
20 |
10 |
|
NaOH-treated |
76 |
14 |
10 |
|
NaOH-treated+molasses/urea |
65 |
20 |
15 |
|
Source: Kayouli 1979 |
|||
|
Table 4.20: Proportions of VFAs in the rumen fluid from cattle given wheat straw untreated (U) or treated with sodium hydroxide (T) or sodium carbonate (C). |
||||
|
|
|
VFA, % |
||
|
|
Total VFA |
HAc |
HProp |
HBut |
|
U |
76 |
72 |
20 |
5 |
|
T |
85 |
73 |
19 |
6 |
|
C |
84 |
73 |
19 |
5 |
|
Source: Sriskandarajah and Kellaway 1984 |
||||
The poor predictability of livestock performance on tropical feed resources using relationships derived in temperate countries appears to be mainly due to the differences in the end-products of rumen fermentation and digestion.
Basal metabolic rate, usually measured as heat production in the post absorptive state, is the basis for estimating the energy needs of animals for maintenance. Considerable research of a direct or indirect nature indicate that substrate used by animals in starvation is not necessarily that required for body maintenance.
In post absorptive animals, especially those which were previously well-fed it is likely that considerable heat may be generated in futile cycles of metabolism because the nutrients mobilised from tissue resources are imbalanced to meet the needs of the animal for maintenance of homeostasis when sedentary. There is evidence to support this hypothesis. Sheep which were losing weight (mobilising body reserves) used metabolisable energy less efficiently than when they were gaining weight (Graham and Searle, 1979).
Fattet et al, (1984) (Table 4.21) fed sheep on three levels of ammoniated straw and, using regression analysis, showed that the basal heat production was 20% less than that predicted from calorimetric measurements. Furthermore, when they added a source of bypass protein (fish meal) to the diet, the animals changed from negative to positive nitrogen balance and lost less fat (Table 4.21). The supposition from these findings is that there were ``futile cycles of metabolism" with excessive heat loss, when ammoniated straw was fed without supplementary bypass protein.
|
Table. 4.21: The effects of supplements of fish meal on the efficiency of utilisation of straw-based diets by sheep. |
||||
|
|
|
No supplement |
120 g/d fishmeal |
|
|
Initial Wt. (kg) |
|
45 |
43 |
|
|
Final Wt. (kg) |
|
45 |
49 |
|
|
Daily LWt gain (gjd) |
0 |
68 |
||
|
Intake (g/d) |
|
|
|
|
|
Straw |
|
860 |
760 |
|
|
Molasses |
|
43 |
43 |
|
|
Fishmeal |
|
0 |
120 |
|
|
Changes in carcass composition |
|
|
||
|
Protein (g) |
|
- 140 |
+890 |
|
|
Energy (MJ) |
|
-59 |
- 16 |
|
|
Fat (g) |
|
-1400 |
-930 |
|
|
Source: Fattet et al.(1984) |
||||
The point that is being brought out, is that heat production in the post absorptive state may overestimate the amount of substrate that needs to be oxidised to maintain homeostasis.
That animals increase their heat production in response to an imbalancing of the diet was well shown in the studies by Tyrrell et al. (1979) (see Figure 4.22). That there is excessive heat production by animals when nutrients are imbalanced explains why in some situations supplementation with bypass protein has led to better feed conversion without necessarily stimulating intake.
The suggestion that basal metabolic heat production does not represent maintenance energy requirements appears logical on evolutionary grounds. When feed quantity or quality deteriorated because of weather conditions, ruminants were required to migrate for long distances to new grazing areas, therefore a mobilisation of tissue components high in fat, relative to protein or glucose precursors was beneficial since the main substrates for continuous activity are the long chain fatty acids.
Balancing nutrients for a particular productive state (eg. by feeding a protein that bypasses the rumen) usually increases feed intake. However, there are a number of reports where supplementation with protein meals has not elicited a feed intake response in ruminants.
There are a number of reasons for these differences which are probably all related. Possibly the limiting nutrient was not corrected by the supplement or the priority rating for the critical nutrients, which depends on the particular productive state (eg. milk production versus work), was different.
Feed intake is likely to be depressed most when there is an excess of C2 energy (acetate and butyrate relative to glucogenic precursors) and the requirement for glucose is high. In these circumstances feed intake will respond to supplements that provide glucose precursors. However, if glucose supplies are adequate, but amino acids are limiting, the animal will tend to synthesise fat and the response to additional absorbed amino acids is likely to be reflected at the same bodyweight in an increased efficiency of bodyweight gain without an effect on intake.
The genotype and the stage of development of the animal influence its need for nutrients. Young growing animals that mature at a low bodyweight (eg. Hereford) will need more dietary fat, protein and glucose precursors than one which matures at a high bodyweight (eg. Zebu). The Zebu requires more protein and less glucose precursors and fat in the growing phase than the Hereford. This means that on low-nitrogen/low-digestibility forages, the feed intake of the Zebu should be affected less than that of the Hereford. If this is correct, the Zebu will respond more to supplementation with fermentable N (because of the effect on microbial growth rate in the rumen) and the Hereford should respond more to protein supplementation. Recently, it has been demonstrated that the Zebu is more able to conserve urea-N than Bos taurus animals (Hunter and Vercoe 1985) and is therefore less dependent on feed N; this together with its lower requirements for glucose during the growth phase is a great advantage. Together they may be the physiological basis for the superior performance of Zebus under tropical conditions.
When animals are in physiological states that require more glucose relative to other nutrients (eg. late pregnancy), feed intake and the efficiency of feed utilisation are likely to be depressed to a greater extent by a deficiency of an essential nutrient. Conversely, there will be a greater response to supplementation with increasing demand (pregnancy and lactation) as demonstrated by Lindsay et al. (1982) (Table 9.8 vs Table 9.9).
The major conclusion that arises from the discussions in this chapter is that it is the balance among the three major groups of metabolites (amino acids, glucose and long-chain fatty acids) that determines animal productivity and the efficiency with which the metabolisable energy is used for a particular productive purpose (eg. work, growth, reproduction and lactation).
The requirements for amino acids are well recognised. The roles of glucose and LCFAs have only become apparent as a result of the increasing understanding of the constraints to animal production on so-called ``low-quality" diets (Leng and Preston 1976; Preston and Leng 1980; Leng and Preston 1985).
There are two important issues that arise:
Neither the system of proximate analysis nor the more recent version based on fibre fractionation can predict the balance of the critical nutrients
Nutrient requirements for a particular productive purpose expressed in terms of metabolisable or net energy do not take into account the interactions among the critical nutrients.
New approaches which predict the outcome of digestion and metabolism are needed for the development of feeding systems, and guidelines are needed as to how available feed resources and the animal (including the rumen) can be manipulated so as to optimise the efficiency with which feed resources are used.
The critical nutrients limiting production in different physiological states. These nutrients must be supplied in sufficient quantities and ratios for the particular function. When the balances of these nutrients absorbed are optimised both feed intake and feed efficiency are increased. Physiological function Limiting nutrients Growth (lean) Amino acids Growth (fattening) Glucose, LCFAs, amino acids Puberty Glucose, amino acids Conception Glucose, amino acids Pregnancy Glucose, amino acids Lactation Glucose, amino acids LCFAs Work Glucose, LCFAs LCFAs = long-chain fatty acids
|
Table 4.22: The critical nutrients limiting p1'Oduction in different physiological states. These nutrients must be supplied in sufficient quantities and ratios for the particular function. When the balances of these nutrients absorbed are optimised both feed intake and feed efficiency are incT'eased. |
|
|
Physiological function |
Limiting nutrients |
|
Growth (lean) |
Amino acids |
|
Growth (fattening) |
Glucose, LCFAs, Amino acids |
|
Puberty |
Glucose, amino acids |
|
Conception |
Glucose, amino acids |
|
Pregnancy |
Glucose, amino acids |
|
Lactation |
Glucose, amino acids, LCFAs |
|
Work |
Glucose, LCFAs, |
|
LCFAs Long chain fatty acids |
|
In order to optimise animal productivity on a particular basal feed resource, the practical approach is by supplementation to ensure:
An efficient rumen microbial ecosystem
An optimum balance among the end-products of digestion.
Supplements that provide protein and/or fat are the most appropriate and in practice can be provided by oilseed meals and milling offals (eg. rice, maize and wheat brans) as will be discussed in Chapter 7.
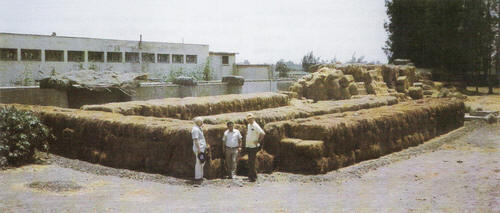 |
 |
 |
|
Top plate:
Industrial
scale
straw treatment
by
ammoniation
(Egypt-EI
Fouly
H A) |